
Download
ORIGINAL ARTICLE
Global, regional, and national burdens of atopic dermatitis from 1990 to 2021: a trend analysis
Xiaosong Zhenga, Jian Wangb, Shuling Tangb, Xia Leib, Ya Ju Duanb*
aMaternal and Child Health Hospital of Hubei Province, Tongji Medical College, Huazhong University of Science and Technology, Wuhan, China
bLiyuan Hospital of Tongji Medical College of Huazhong University of Science and Technology, Wuhan, China.
Abstract
Background: Atopic dermatitis (AD) is a widespread dermatological condition, particularly affecting children globally. In spite of its high prevalence, comprehensive data on its burden and trends are limited.
Methods: Using the Global Burden of Disease Study 2021 (GBD 2021) data from 204 countries and 21 regions (1990–2021), we analyzed AD prevalence, incidence, and disability-adjusted life years (DALYs), calculating age-standardized rates (ASRs) and estimated annual percentage changes (EAPCs).
Objective: This study is designed to examine the temporal trends in the burden of AD across global, regional, and national levels.
Results: Globally, AD cases rose from 107.5 million (1990) to 129.0 million (2021). The high-income Asia Pacific region had instances of age-standardized prevalence (ASPR), age-standardized incidence rate (ASIR), and age-standardized DALYs, with Japan leading among 204 countries. High sociodemographic index (SDI) regions showed the highest ASPR, ASIR, and age-standardized DALYs, while medium and high SDI regions experienced the largest increases. Females exhibited higher ASRs than males. Age-specific prevalence and DALYs peaked in children aged 5–9 years, whereas incidence was the highest in those aged under 5 years. Projections based on 1990–2021 data suggest declining global trends in ASPR, ASIR, and age-standardized DALYs by 2050.
Conclusions: Global AD prevalence and DALYs continue to rise, whereas ASPR and age-standardized DALYs are declining. High SDI regions exhibit the highest prevalence, yet low-income countries show increasing age-standardized DALYs, underscoring profound regional heterogeneity. Thus, the absolute burden of AD is escalating worldwide, while individual-level risk appears to be improving.
Key words: atopic dermatitis, age-standardized prevalence rate (ASPR), age-standardized incidence rate (ASIR), disability-adjusted life years (DALYs)
*Corresponding author: Ya Ju Duan, Department of Dermatology, Liyuan Hospital of Tongji Medical College of Huazhong University of Science and Technology, No. 39, Yanhu Avenue, East Lake Scenic Area, Wuhan City, Hubei Province, P.R. China, 430077. Email address: [email protected]
Received 31 October 2025; Accepted 11 January 2026; Available online 1 May 2026
Copyright: Duan YJ, et al.
This open access article is licensed under Creative Commons Attribution 4.0 International (CC BY 4.0). http://creativecommons.org/licenses/by/4.0/
Introduction
Atopic dermatitis (AD) is a prevalent, chronic, relapsing inflammatory skin disease associated with significant social and economic burdens.1,2 According to a global burden of disease (GBD) study, the prevalence of AD ranges from 15% to 20% in children and up to 10% in adults.3 In the related GBD study, AD ranked 18th among all nonfatal diseases and 1st among skin diseases in terms of DALYs.4
Although AD is traditionally regarded as a childhood disease, recent epidemiological studies have demonstrated that it is also common in adulthood and old age.5,6 The pathogenesis of AD encompasses skin barrier defects, T-helper cell type 2 (Th2)-dominated skin inflammation, and heightened skin responsiveness to inflammatory stimuli.7,8 Pruritus, the cardinal symptom of AD, can lead to sleep disturbances, decreased work or school productivity, and anxiety and depression.9 These sequelae impose additional health and economic burdens on patients and their families.10,11 Patients with AD have a higher risk of cardiovascular disease and myocardial infarction compared to healthy individuals.7 Moreover, medications used to treat moderate to severe AD in older adults may affect the management of other pre-existing conditions.12 The direct medical costs and indirect costs associated with AD place a substantial economic burden on patients, families, and society.13 Direct health care costs include prescription costs, medical bills, emergency room charges, and hospitalization costs. Indirect costs encompass decreased work productivity (presenteeism), absenteeism (missing work), and impaired quality of life.14 A study on the economic burden of out-of-pocket health care costs for AD in the United States revealed that 41.9% of patients incurred out-of-pocket costs of up to $1,000.15 In Central and Eastern European countries, the annual loss of quality-adjusted life-years (QALYs) because of AD ranges from 1,832 to 58,596, corresponding to a loss of between 380,000 and approximately 100 million euros per country. Annual productivity losses range from €3.6 to €14.89 billion. The total implicit burden of AD is between 0.11% and 0.43% of GDP.16 In Germany, the total annual cost of AD is estimated to be €200 million.17
Therefore, this study delivers the most comprehensive and up-to-date assessment of the global burden of AD through 2021. Compared with previous reports, our analysis incorporates multidimensional stratification, delineating not only overarching global and regional trends but also, critically, the differential distribution of disease burden by sex, age, and sociodemographic index (SDI). These granular insights enable precise identification of high-risk populations and will inform targeted public health interventions and equitable resource allocation.
Methods
Data collection
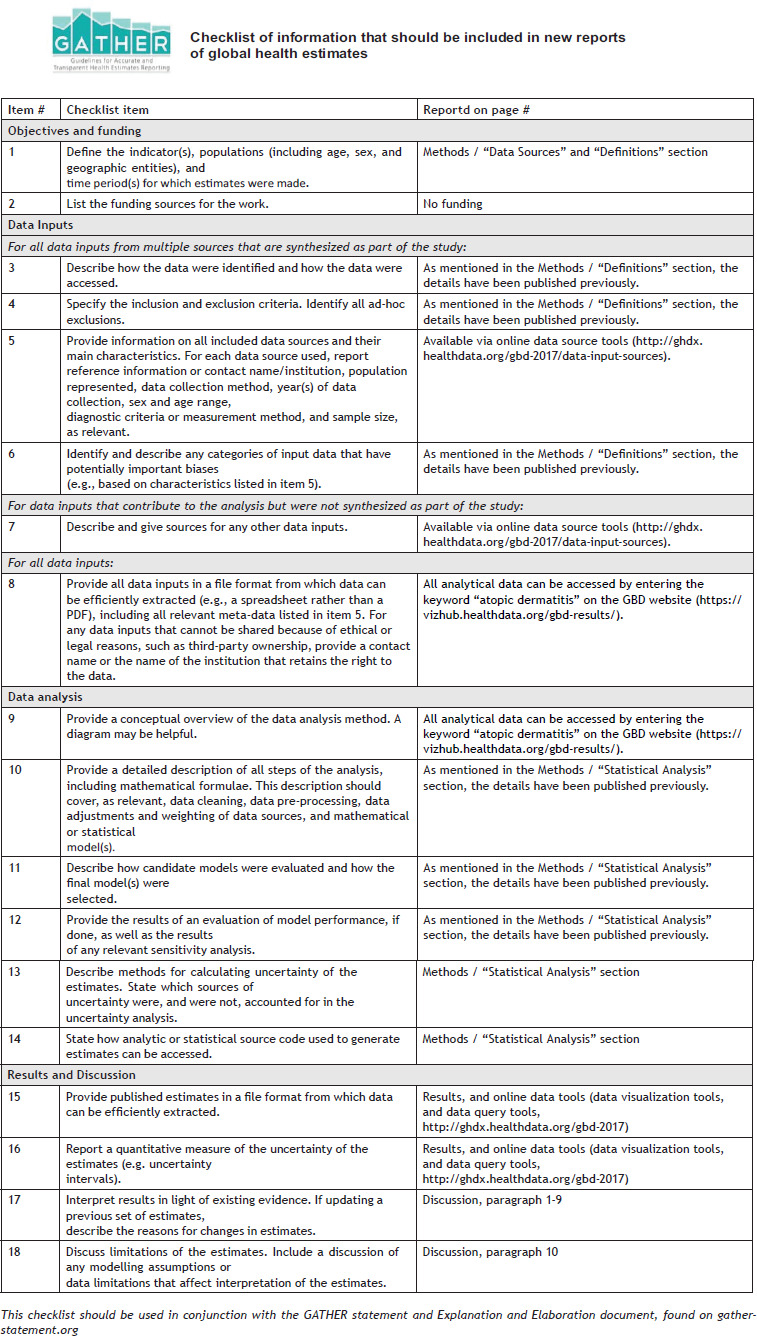
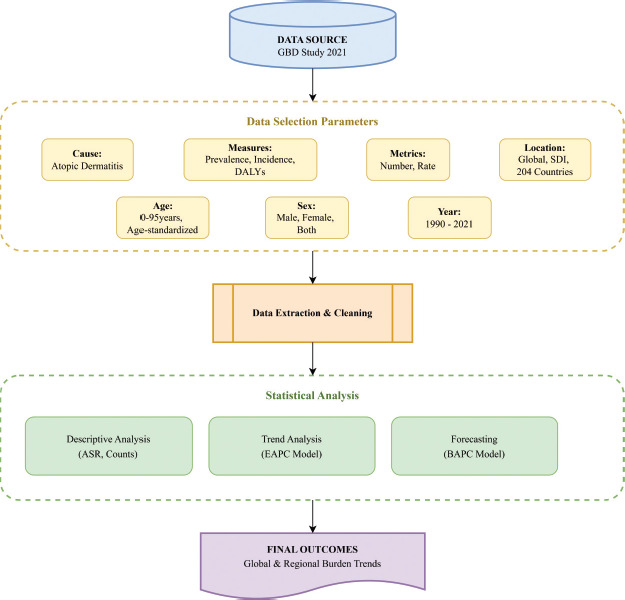
The GBD 2021 study comprehensively evaluated the health impacts associated with 369 diseases, injuries, and impairments, as well as 88 risk factors, across 204 countries and territories.18 The detailed research framework and analytical methods are documented in previous studies (https://ghdx.healthdata.org/gbd-2021).18 All analytical data can be accessed by entering the keyword “atopic dermatitis” on the GBD website (https://vizhub.healthdata.org/gbd-results/). Since the GBD data are anonymized, the Institutional Review Board of the University of Washington has determined that other researchers may use these data without requiring patient consent.19 The detailed procedure is illustrated in Figure S1. This study is compliant with the Guidelines for Accurate and Transparent Health Estimates Reporting (S1 GATHER S4GATHER Checklist).
Estimation framework
This study employed precise modeling methods to assess the impact of AD.18 Briefly, the study utilized the Disease Modeling-Bayesian Meta-Regression 2.1 tool to determine disease incidence and prevalence. This software incorporates various parameters, epidemiological relationships, and geospatial data to ensure reliable calculations. Disease burden was also expressed in terms of disability-adjusted life years (DALYs), a metric that quantifies the difference between healthy life and life affected by disease. DALYs are calculated as the sum of years lost because of disability and years of life lost because of premature death. For nonfatal diseases such as AD, DALYs primarily reflect years lost because of disability.
SDI
SDI quantifies regional development levels using indicators such as the total fertility rate (TFR) among women under 25, educational attainment, and per capita income. The SDI score ranges from 0 to 1, with 0 representing the lowest level of development, and 1 representing the highest.20 In this analysis, countries and territories were categorized into five SDI groups—low, low-middle, middle, high-middle, and high—to investigate the association between socioeconomic status and AD.
Forecasting
To project the future trends of AD from 2022 to 2050, we employed the Bayesian age-period-cohort (BAPC) analysis method, leveraging global epidemiological data from 1990 to 2021. The future standardized population data were sourced from the 2021 population projections in the GBD database. The BAPC method was chosen for its robust handling of complex high-dimensional data, a common feature in large-scale epidemiological studies.21 The BAPC model is rooted in the age-period-cohort (APC) framework, which elucidates disease trends by accounting for age, period, and cohort effects. However, the classic APC model often encounters challenges in parameter estimation because of collinearity among its factors. To mitigate this issue, we integrated a Bayesian framework into the APC model. A key advantage of the Bayesian model is its utilization of the integrated nested laplace approximation (INLA) method to approximate marginal posterior distributions. In this study, BAPC analysis was conducted using the “BAPC” and “INLA” packages within the R statistical software environment.
Statistical analyses
We calculated the trends in age-standardized prevalence rate (ASPR),age-standardized incidence rate (ASIR) and DALYs for AD from 1990 to 2021 using the estimated annual percentage change (EAPC). An ASR was classified as increasing if both the EAPC and the lower limit of its 95% confidence interval were positive. Conversely, an ASR was classified as decreasing if both the EAPC and the upper limit of its 95% confidence interval were negative. If neither condition was met, the ASR was classified as stable. Data analysis and graphical representations were performed using R software version 4.3. The detailed analytical methods used for this study have been published previously,22 and the related codes can be accessed at http://ghdx.healthdata.org/gbd-2017/code.
Results
Prevalence, incidence, and DALYs in global
From 1990 to 2021, the global prevalence of AD increased by 20%, rising from 107.5 million (95% Uncertainty Interval [UI]: 103.0 to 112.1) to 129.0 million (95% UI: 123.9 to 134.1). Conversely, the ASPR for AD decreased from 1,885.43 (95% UI: 1,808.98 to 1,962.25) in 1990 to 1,728.51 (95% UI: 1,658.51 to 1,798.60) in 2021, with an EAPC of −0.27 (95% CI: −0.28 to −0.27) (Table 1). During this period, the global number of AD incidence increased from 13,479,200 (95% UI: 12,764,400 to 14,220,800) in 1990 to 16,006,700 (95% UI: 15,211,200 to 16,819,900) in 2021, corresponding to an 18.78% increase over the 31-year period. The ASIR decreased from 223.02 (95% UI: 209.51 to 231.97) in 1990 to 220.58 (95% UI: 209.51 to 231.97) in 2021, with an EAPC of −0.20 (95% CI: −0.21 to −0.19) (Table 1). Meanwhile, the absolute number of DALYs because of AD increased from 4,698,000 (95% UI: 2,421,100 to 7,825,800) in 1990 to 5,621,500 (95% UI: 2,889,200 to 9,367,100) in 2021. However, age-standardized DALYs decreased from 82.13 (95% UI: 42.35 to 136.74) in 1990 to 75.45 (95% UI: 38.75 to 125.64) in 2021, with an EAPC of −0.26 (95% CI: −0.27 to −0.26) (Table 1).
Table 1 Global and regional trends in AD burden: prevalence, incidence, and DALYs (1990–2021).
| Location | Atopic dermatitis | ||
|---|---|---|---|
| ASR_1990 | ASR_2021 | EAPC_95%CI | |
| Prevalence | |||
| Global | 1885.43 (1808.98–1962.25) | 1728.51 (1658.51–1798.6) | −0.27 (−0.28 to −0.27) |
| High SDI | 3364.38 (3234.39–3507.08) | 3233.96 (3105.94–3369.25) | −0.14 (−0.15 to −0.13) |
| High-middle SDI | 2103.18 (2018.71–2191.06) | 2065.66 (1978.78–2151.14) | 0.04 (0.01 to 0.08) |
| Middle SDI | 1589.36 (1523.69−1658.38) | 1591.28 (1526.71−1657.34) | 0 (0 to 0.01) |
| Low-middle SDI | 1499.34 (1434.36–1566.92) | 1450.53 (1388.11–1514.66) | −0.12 (−0.13 to −0.11) |
| Low SDI | 1199.62 (1147.07–1252.31) | 1171.1 (1119.89–1223.87) | −0.08 (−0.09 to −0.07) |
| Andean Latin America | 1694.36 (1622.41–1772.01) | 1692.65 (1620.76–1770.4) | 0.01 (0 to 0.02) |
| Australasia | 2534.56 (2389.13–2672.41) | 2535.67 (2392.77–2686.33) | 0.01 (−0.01 to 0.02) |
| Caribbean | 1947.47 (1842.36–2049.01) | 1945.56 (1840.66–2046.99) | 0 (0 to 0) |
| Central Asia | 4399.59 (4163.54–4640.9) | 4387.01 (4148.98–4628.2) | −0.01 (−0.01 to −0.01) |
| Central Europe | 1758.86 (1679.17–1836.85) | 1774.87 (1691.64–1858.31) | 0.02 (0.02 to 0.03) |
| Central Latin America | 1790.73 (1709.66–1874.78) | 1773.33 (1690.09–1853.45) | −0.04 (−0.04 to −0.03) |
| Central Sub-Saharan Africa | 982.02 (920.51–1037.71) | 981.16 (919.73–1036.77) | 0 (−0.01 to 0) |
| East Asia | 1380.79 (1320.67–1441.77) | 1369.02 (1309.83–1425.29) | 0 (−0.02 to 0.02) |
| Eastern Europe | 2856.81 (2762.95–2960.24) | 3003.42 (2904.17–3107.67) | 0.21 (0.17 to 0.24) |
| Eastern Sub-Saharan Africa | 1022.21 (977.67–1064.8) | 1034.1 (987.87–1080.04) | 0.05 (0.04 to 0.06) |
| High-income Asia Pacific | 4605.74 (4402.01–4811.25) | 4596.03 (4402.96–4811.08) | −0.02 (−0.04 to 0) |
| High-income North America | 3139.72 (3036.67–3247.61) | 3131.86 (3023.58–3244.21) | −0.03 (−0.06 to −0.01) |
| North Africa and Middle East | 1430.18 (1354.47–1502.71) | 1374.93 (1300.26–1444.3) | −0.15 (−0.15 to −0.14) |
| Oceania | 1725.64 (1632.78–1833.8) | 1725.48 (1632.52–1833.58) | 0 (0 to 0) |
| South Asia | 1466.66 (1400.48–1539.32) | 1467.56 (1400.88–1540.43) | −0.02 (−0.03 to −0.01) |
| Southeast Asia | 1645.5 (1575.15–1719.11) | 1645.49 (1571.3–1719.24) | 0 (0 to 0.01) |
| Southern Latin America | 3213.96 (3034.27–3397.32) | 3210.54 (3031.03–3393.55) | 0 (0 to 0) |
| Southern Sub-Saharan Africa | 1041.19 (994.77–1090.18) | 1039.97 (992.88–1089.07) | 0 (−0.01 to 0) |
| Tropical Latin America | 2362.95 (2270.41–2460.92) | 2365.36 (2272.94–2464.23) | 0 (−0.01 to 0) |
| Western Europe | 3770.89 (3598.11–3954.62) | 3761.1 (3583.37–3938.45) | −0.02 (−0.03 to 0) |
| Western Sub-Saharan Africa | 1048.05 (1004.21–1090.18) | 1052.92 (1008.44–1095.34) | 0.02 (0.02 to 0.03) |
| Incidence | |||
| Global | 234.78 (223.02–247.07) | 220.58 (209.51–231.97) | −0.2 (−0.21 to −0.19) |
| High SDI | 364.39 (345.43–384.48) | 356.59 (338.03–376.39) | −0.08 (−0.1 to −0.07) |
| High-middle SDI | 240.35 (227.55–253.98) | 242.06 (228.98–255.8) | 0.06 (0.03 to 0.1) |
| Middle SDI | 217.88 (206.98–229.38) | 216.92 (205.93–228.01) | −0.02 (−0.02 to −0.01) |
| Low-middle SDI | 205.99 (194.71–218.53) | 199.27 (188.54–210.86) | −0.13 (−0.13 to −0.12) |
| Low SDI | 168.7 (159.8–178.31) | 164.02 (155.25–173.16) | −0.09 (−0.1 to −0.09) |
| Andean Latin America | 226.66 (214.67–239.34) | 226.52 (214.55–239.16) | 0.01 (0 to 0.02) |
| Australasia | 338.61 (315.82–361.52) | 338.68 (314.33–364.6) | 0 (−0.01 to 0.01) |
| Caribbean | 263.22 (244.18−283.46) | 263.09 (244–283.32) | 0 (0 to 0) |
| Central Asia | 414.92 (383.23–447.64) | 413.83 (381.95–446.64) | −0.01 (−0.01 to −0.01) |
| Central Europe | 225.86 (212.63–241.46) | 228.01 (214.91–244.41) | 0.02 (0.01 to 0.02) |
| Central Latin America | 249.05 (234.79–264.98) | 248.13 (233.79–263.46) | −0.02 (−0.03 to −0.02) |
| Central Sub-Saharan Africa | 146.16 (135.79–157.19) | 146.06 (135.69–157.03) | 0 (−0.01 to 0) |
| East Asia | 199.95 (189.77–210.52) | 198.49 (189–208.52) | 0 (−0.03 to 0.02) |
| Eastern Europe | 211.61 (200.84–223.39) | 222.53 (211.03–235.27) | 0.22 (0.18 to 0.27) |
| Eastern Sub-Saharan Africa | 146.11 (138.01–154.02) | 147.77 (139.31–155.78) | 0.05 (0.04 to 0.06) |
| High-income Asia Pacific | 473.98 (447.59–501.7) | 474.81 (448.38–505.41) | 0 (−0.02 to 0.01) |
| High-income North America | 334.7 (319.72–350.29) | 334.63 (319.39–349.65) | −0.02 (−0.03 to 0) |
| North Africa and Middle East | 188.43 (176.31–200.36) | 183.14 (171.05–194.83) | −0.11 (−0.11 to −0.1) |
| Oceania | 236.05 (217.85–254.74) | 235.99 (217.79–254.67) | 0 (0 to 0) |
| South Asia | 207.18 (195.37–220.53) | 207.29 (195.41–220.57) | −0.02 (−0.03 to −0.01) |
| Southeast Asia | 220.97 (208.65–233.73) | 221.53 (209.56–233.87) | 0.01 (0.01 to 0.02) |
| Southern Latin America | 388.03 (357.85–417.58) | 387.79 (357.7–417.31) | 0 (0 to 0) |
| Southern Sub-Saharan Africa | 152.89 (143.91–161.75) | 152.75 (143.72–161.57) | 0 (0 to 0) |
| Tropical Latin America | 300.93 (286.23–315.73) | 301.13 (286.24–316.05) | 0 (−0.01 to 0) |
| Western Europe | 423.07 (395.94–450.91) | 421.72 (394.56–448.97) | −0.02 (−0.02 to −0.01) |
| Western Sub-Saharan Africa | 146.5 (139.16–153.87) | 147 (139.61–154.2) | 0.02 (0.01 to 0.02) |
| DALYs | |||
| Global | 82.13 (42.35–136.74) | 75.45 (38.75–125.64) | −0.26 (−0.27 to −0.26) |
| High SDI | 146.99 (75.55–244.81) | 141.11 (72.7–234.6) | −0.14 (−0.16 to −0.13) |
| High-middle SDI | 92.22 (47.52–153.26) | 90.8 (46.58–151.24) | 0.05 (0.02 to 0.09) |
| Middle SDI | 69.58 (35.9–116.47) | 69.84 (35.96–116.91) | 0.01 (0.01 to 0.02) |
| Low-middle SDI | 65.27 (33.66–109.6) | 63.42 (32.6–105.75) | −0.11 (−0.12 to −0.1) |
| Low SDI | 52 (26.92–87.37) | 51.1 (26.14–85.42) | −0.05 (−0.06 to −0.05) |
| Andean Latin America | 73.7 (37.91–123.22) | 73.89 (38.34–123.07) | 0.03 (0.02 to 0.04) |
| Australasia | 110.82 (56.77–184.05) | 111.17 (57.59–187.59) | 0.01 (0 to 0.02) |
| Caribbean | 84.7 (43.93–141.95) | 84.56 (44.1–142.12) | 0 (−0.01 to 0) |
| Central Asia | 192.48 (99.3–323.8) | 192.37 (98.8–324.14) | 0 (0 to 0) |
| Central Europe | 77.58 (39.94–130.56) | 78.36 (40.37–132.13) | 0.03 (0.02 to 0.04) |
| Central Latin America | 78.34 (40.31–131.14) | 77.72 (39.95–130.08) | −0.03 (−0.04 to −0.02) |
| Central Sub-Saharan Africa | 42.56 (21.73–72.23) | 42.89 (22.11–71.52) | 0.03 (0.02 to 0.03) |
| East Asia | 60.84 (31.52–102.16) | 60.48 (31.37–101.51) | 0.01 (−0.01 to 0.03) |
| Eastern Europe | 125.53 (64.4–207.81) | 132.17 (67.33–219.48) | 0.22 (0.18 to 0.26) |
| Eastern Sub-Saharan Africa | 44.33 (22.81–74.38) | 45.19 (23.19–75.5) | 0.08 (0.07 to 0.09) |
| High-income Asia Pacific | 202.21 (103.15–337.13) | 202.07 (103.47–337.3) | −0.02 (−0.04 to 0) |
| High-income North America | 136.34 (70.34–225.64) | 135.37 (69.85–222.95) | −0.05 (−0.07 to −0.02) |
| North Africa and Middle East | 62.58 (32.42–105.74) | 60.23 (30.95–101.13) | −0.14 (−0.15 to −0.13) |
| Oceania | 75.31 (38.83–126.44) | 75.49 (38.93–127.9) | 0.01 (0 to 0.01) |
| South Asia | 63.8 (32.98–107.16) | 64.23 (33.06–106.96) | 0 (−0.01 to 0.02) |
| Southeast Asia | 71.93 (37.13–122.04) | 72.22 (37.33–122.5) | 0.02 (0.02 to 0.02) |
| Southern Latin America | 140.54 (71.91–237.06) | 140.43 (71.94–236.14) | 0 (−0.01 to 0) |
| Southern Sub-Saharan Africa | 45.53 (23.63–76.7) | 45.48 (23.48–76.47) | 0 (0 to 0) |
| Tropical Latin America | 102.14 (53.31–168.78) | 102.49 (53.33–169.99) | 0.01 (0 to 0.02) |
| Western Europe | 164.94 (85.25–275.87) | 164.47 (85.21–275.32) | −0.02 (−0.03 to 0) |
| Western Sub-Saharan Africa | 45.49 (23.41–76.98) | 45.94 (23.77–77.64) | 0.05 (0.04 to 0.06) |
Atopic dermatitis (AD); Sociodemographic index (SDI); Age-standardized rate (ASR); Disability-adjusted life years (DALYs); and Estimated annual percentage change (EAPC).
Regional trends
Prevalence, incidence, and DALYs in SDI quintiles
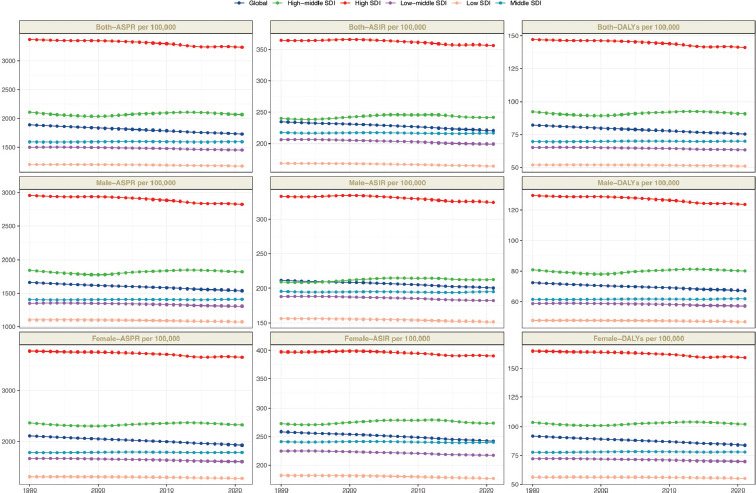
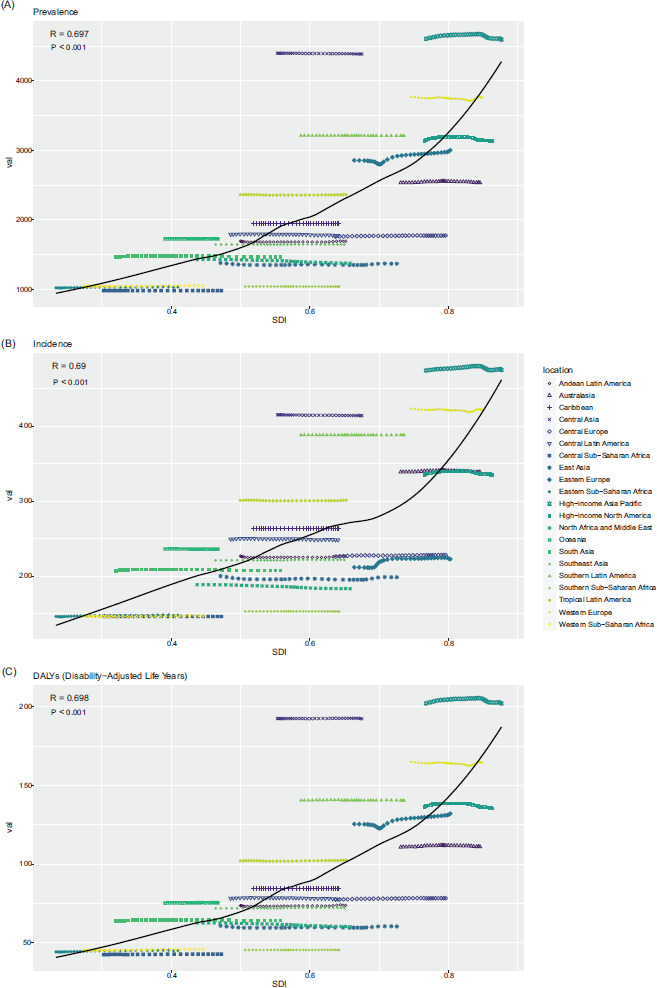
Regions with higher SDI levels exhibited higher ASPRs, ASIRs, and DALYs for AD (Figure 1, Figure S3, Table 1). Specifically, in 2021, high SDI regions had the highest ASPR at 3,233.96 (95% UI: 3,105.94 to 3,396.25), yet they also experienced the most substantial decline, with an EAPC of −0.14 (95% CI: −0.15 to −0.13). Conversely, low SDI regions had the lowest ASPR at 1,171.10 (95% UI: 1,119.89 to 1,233.87) and demonstrated the smallest decline (EAPC: −0.08; 95% CI: −0.09 to −0.07). Among the five SDI regions, only the medium-high SDI region exhibited an increasing trend, with an EAPC of 0.04 (95% CI: 0.01 to 0.08). Similarly, in 2021, the ASIR for AD was elevated only in the medium-high SDI region, with an EAPC of 0.06 (95% CI: 0.03 to 0.10). However, the mid-low SDI region had the most pronounced decline, with an EAPC of −0.13 (95% CI: −0.13 to −0.12). In terms of DALYs, age-standardized DALYs for AD were most significantly elevated in the medium-high SDI region in 2021, with an EAPC of 0.05 (95% CI: 0.02 to 0.09). In contrast, the most significant decrease was observed in high SDI regions, with an EAPC of −0.14 (95% CI: −0.16 to −0.13) (Figure S3). A positive correlation was observed between the age-standardized DALYs and the SDI (Figure S3).
Figure 1 Trends in atopic dermatitis prevalence, incidence, and disability-adjusted life-years from 1990 to 2021. Age-standardized prevalence rate (ASPR); age-standardized incidence rate (ASIR); disability-adjusted life years (DALYs).
Prevalence, incidence, and DALYs in 21 GBD area
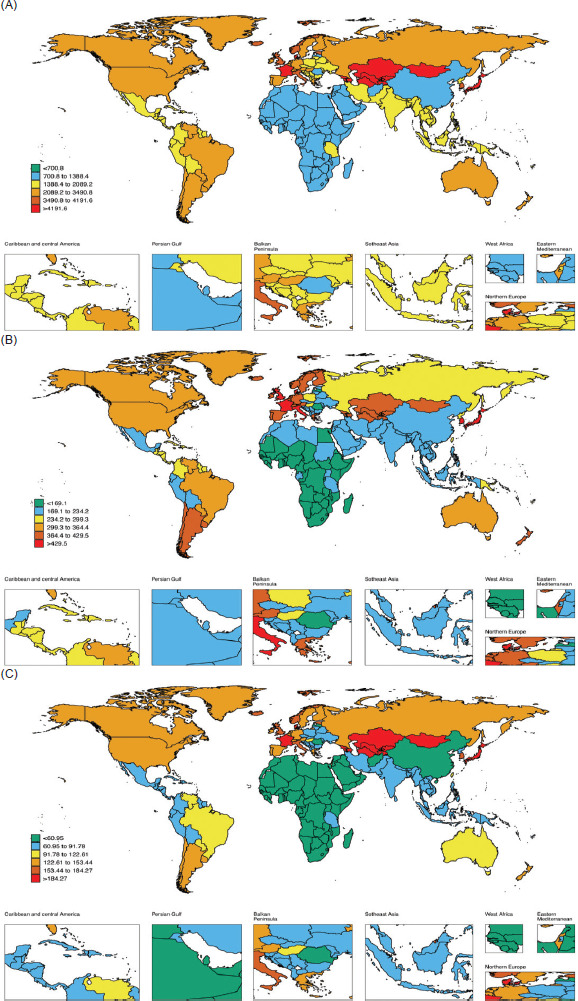
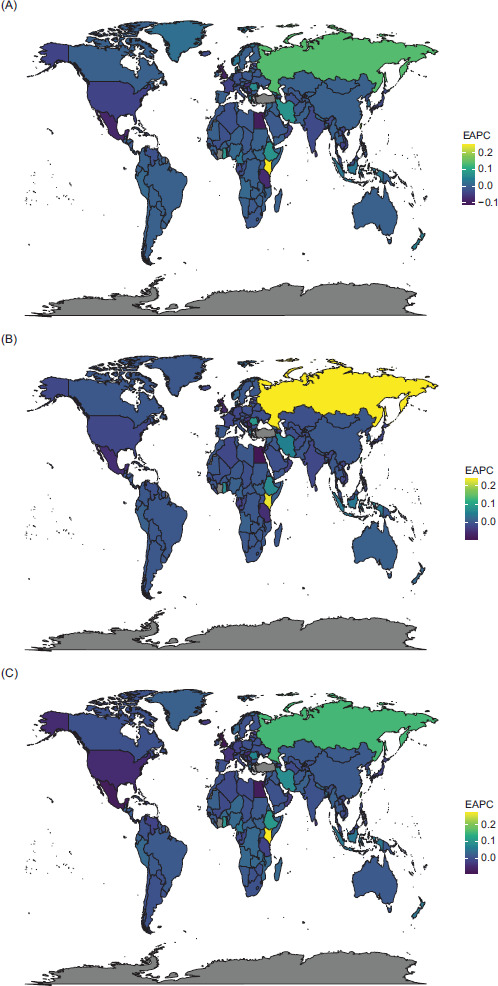
In 2021, the high-income Asia Pacific region had the highest ASPR, ASIR, and DALYs for AD. Inversely, Central Sub-Saharan Africa had the lowest values for these metrics. Specifically, the high-income Asia Pacific region had an ASPR of 4,596.03 (95% UI: 4,402.96 to 4,811.08), followed by Central Asia at 4,387.01 (95% UI: 4,148.98 to 4,628.20), and Western Europe at 3,761.10 (95% UI: 3,583.37 to 3,938.45). In contrast, Central Sub-Saharan Africa had the lowest ASPR at 981.16 (95% UI: 919.73 to 1,036.77). Between 1990 and 2021, the most significant increase in age-standardized prevalence was observed in Eastern Europe, with an EAPC of 0.21 (95% CI: 0.17 to 0.24), while the most substantial decline was in North Africa and the Middle East, with an EAPC of −0.15 (95% CI: −0.15 to −0.14). Regarding the ASIR, the high-income Asia Pacific region had the highest ASIR at 474.81 (95% UI: 448.38 to 505.41), closely followed by Western Europe at 421.72 (95% UI: 394.56 to 448.97), and Central Asia at 413.83 (95% UI: 381.95 to 446.64). Central Sub-Saharan Africa had the lowest ASIR at 146.06 (95% UI: 135.69 to 157.03). As with the ASPR, between 1990 and 2021, Eastern Europe experienced the greatest increase in age-standardized incidence, with an EAPC of 0.22 (95% CI: 0.18 to 0.27), while North Africa and the Middle East saw the largest decrease, with an EAPC of −0.11 (95% CI: −0.11 to −0.10). In terms of age-standardized DALYs, the high-income Asia Pacific region had the highest value at 202.07 (95% UI: 103.47 to 337.30), followed by Central Asia at 192.37 (95% UI: 98.80 to 324.14) and Western Europe at 164.47 (95% UI: 85.21 to 275.32). Central Sub-Saharan Africa had the lowest age-standardized DALYs at 42.89 (95% UI: 22.11 to 71.52). Between 1990 and 2021, age-standardized DALYs increased most significantly in Eastern Europe, with an EAPC of 0.22 (95% CI: 0.18 to 0.26), while the most substantial decline was observed in North Africa and the Middle East, with an EAPC of −0.14 (95% CI: −0.15 to −0.13) (Figure 2 and 3, Figure S3, Table 1).
Figure 2 The global disease burden of atopic dermatitis for both sexes in 204 countries and territories in 2021. (A) Prevalence rate. (B) Incidence rate. (C) DALYs rate. Disability-adjusted life years (DALYs).
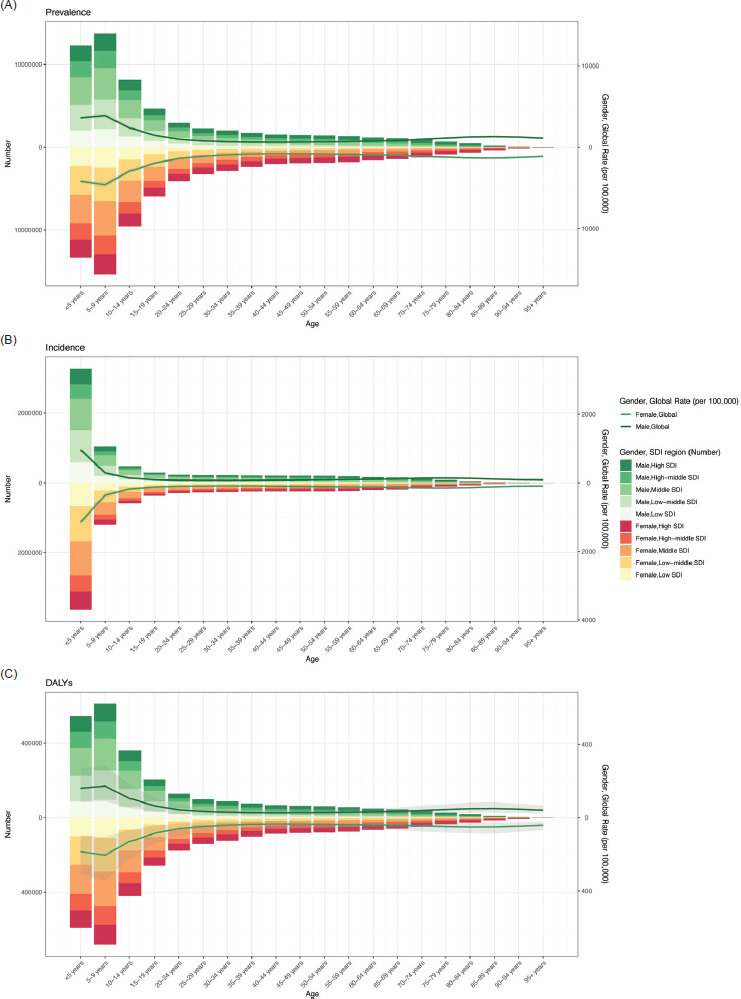
Figure 3 The age-specific numbers and ASR of atopic dermatitis by SDI regions in 2021. (A) Prevalence. (B) Incidence. (C) DALYs. Age-standardized rate (ASR); Sociodemographic Index (SDI); Disability-adjusted life years (DALYs).
Prevalence, incidence, and DALYs in 204 countries
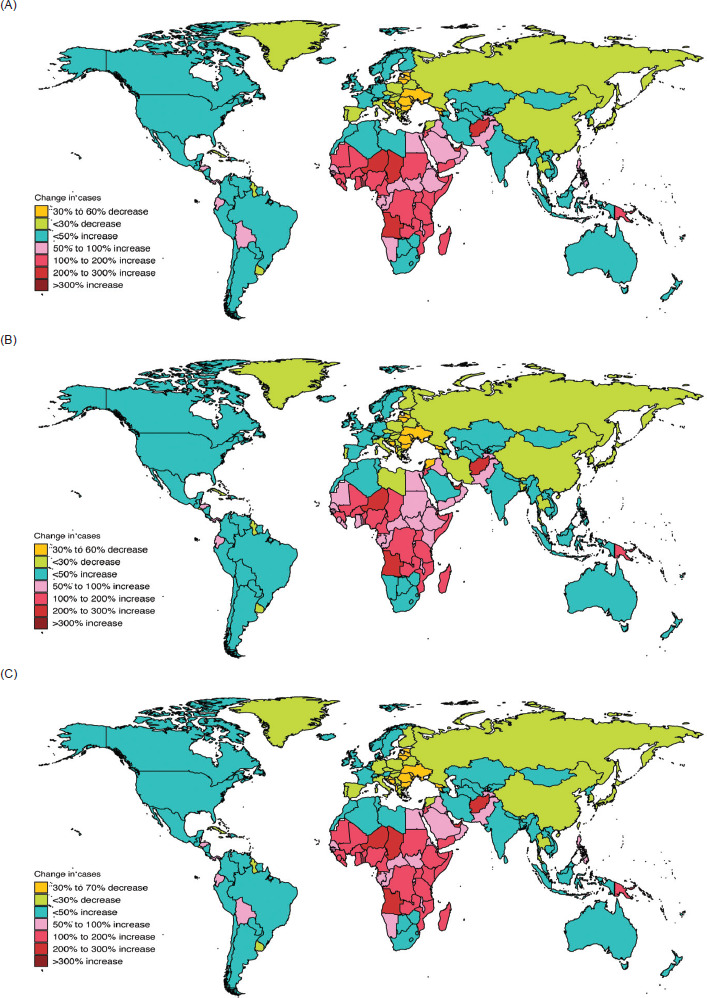
In 2021, Japan exhibited the highest ASPR, ASIR, and DALYs for AD. As for ASPR, Japan had an ASPR of 4,892.58 (95% UI: 4,683.90 to 5,124.84), followed by France at 4,704.28 (95% UI: 4,397.67 to 5,039.86), and Kazakhstan in third place with an ASPR of 4,398.90 (95% UI: 4,158.21 to 4,641.02). However, the most significant increase in age-standardized prevalence of AD compared to 1990 was observed in Kenya, with an EAPC of 0.25 (95% CI: 0.21 to 0.28). Conversely, the Maldives had the most substantial decline, with an EAPC of −0.11 (95% CI: −0.13 to −0.09), while Japan also demonstrated a downward trend, with an EAPC of −0.01 (95% CI: −0.01 to −0.01). Rwanda had the lowest ASPR for AD, with an ASPR of 687.58 (95% UI: 646.68 to733.76). When examining the trend in the prevalence of diseases, Qatar exhibited the most substantial increase in 2021 compared to 1990, with an increase of 409.89 times. This was followed by Afghanistan, with an increase of 229.87 times, and the United Arab Emirates, with an increase of 227.75 times. Conversely, Albania experienced the largest decrease in 2021 compared to 1990 (Figure 4).
Regarding ASIR, Japan had the highest ASIR in 2021 at 494.75 (95% UI: 467.73 to 525.79), while Latvia had the lowest ASIR at 104.03 (95% UI: 98.40 to109.82). However, Japan’s age-standardized incidence of AD showed a decreasing trend compared to 1990, with an EAPC of −0.02 (95% CI: −0.05 to 0). In contrast, the Russian Federation had the largest increase, with an EAPC of 0.24 (95% CI: 0.18 to 0.29), while Egypt had the largest decrease, with an EAPC of −0.09 (95% CI: −0.12 to −0.06). Regarding the trend in incidence cases, Qatar had the most marked increase in 2021 compared to 1990, with an increase of 381.96 times. Afghanistan and Angola followed closely, with increases of 224.84 and 212.95 times, respectively. In stark contrast, Albania had the largest decline in 2021 compared to 1990 (Figure 4).
Figure 4 Change cases of atopic dermatitis for both sexes in 204 countries and territories. (A) Change prevalence cases. (B) Change incidence cases. (C) Change DALYs. Disability-adjusted life years (DALYs).
In terms of DALYs, the results mirrored those observed for age-standardized prevalence. Japan had the highest age-standardized DALYs, with a value of 215.1 (95% UI: 109.77 to 358.88), while Rwanda had the lowest, with age-standardized DALYs of 30.12 (95% UI: 15.45 to 51.39). Compared to 1990, Kenya exhibited the largest increase in age-standardized DALYs, with an EAPC of 0.27 (95% CI: 0.23 to 0.30). Conversely, the United Kingdom had the largest decrease, with an EAPC of −0.09 (95% CI: −0.13 to −0.04) (Figure 2, Tables S1–S3, Figure S2). In assessing the temporal trend of DALYs, Qatar demonstrated the highest increase in 2021 compared to 1990, with an increase of 409.25 times. Afghanistan and Equatorial Guinea followed, with respective increases of 231.79 times and 230.27 times. In contrast, Albania had the most significant decline in 2021 compared to 1990 (Figure 4). Positive correlations were found between the age-standardized DALYs rates and 204 countries (Figure S4).
Burden of AD by age
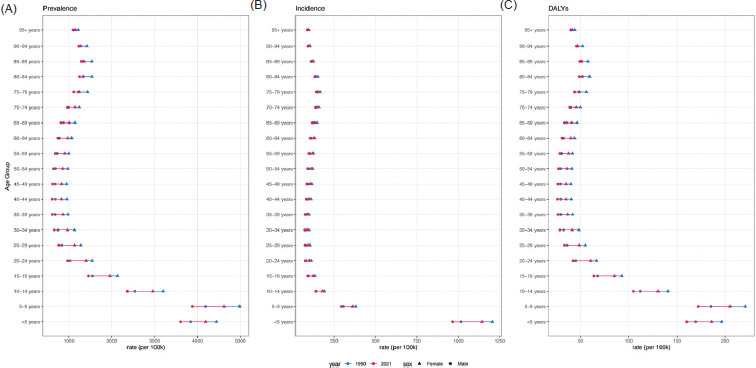
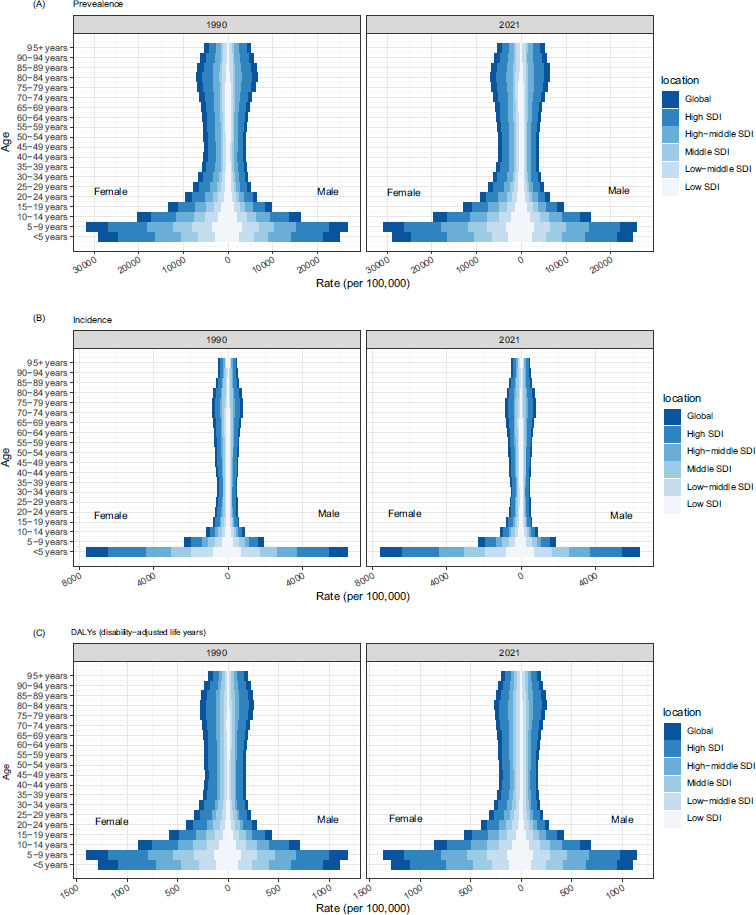
AD is prevalent among children and typically exhibits a decreasing trend with age; however, a slight increase is observed in older age groups. Specifically, in 2021, the global prevalence of AD peaked in the 5–9 years age group, with a prevalence rate of 4,241.21 per 100,000, affecting approximately 29 million individuals. The prevalence decreased in young adults but increased again in older adults, particularly in the 85–89 years age group, where the prevalence rate was 1,326.15. Among the 16 million individuals affected by the disease globally in 2021, 6.9 million (43%) were under the age of 5 years, with an incidence rate of 1,049.61, the highest across all age groups. While the incidence rate decreased in young adults, it increased in the elderly population, with the most pronounced rise observed in the 75–79 years age group, where the incidence rate was 146.26. Age-specific DALYs were also concentrated in the 5–9 years age group, with a DALY rate of 188.08 and a total of approximately 1.29 million DALYs (Figure 5). Thus, AD exhibits a bimodal distribution, commonly affecting children and older adults.
Figure 5 Age-standardized rates of AD by sex, age group, and sociodemographic index, 1990 and 2021. (A) Prevalence, (B) Incidence, (C) DALYs. Disability-adjusted life years (DALYs).
Burden of AD by sex
Globally, from 1990 to 2021, the prevalence of AD was higher in females than in males. In 2021, the age-standardized prevalence of AD was 25% higher in females than in males, with values of 1,928.51 per 100,000 for females compared to 1,535.50 per 100,000 for males. Similarly, the age-standardized incidence was higher in females (241.9 per 100,000) than in males (200.21 per 100,000), and age-standardized DALYs were also higher in females (83.95 per 100,000) than in males (67.27 per 100,000) (Figure 5, Figure S5).
Forecast analysis of AD burden over the following 20 years
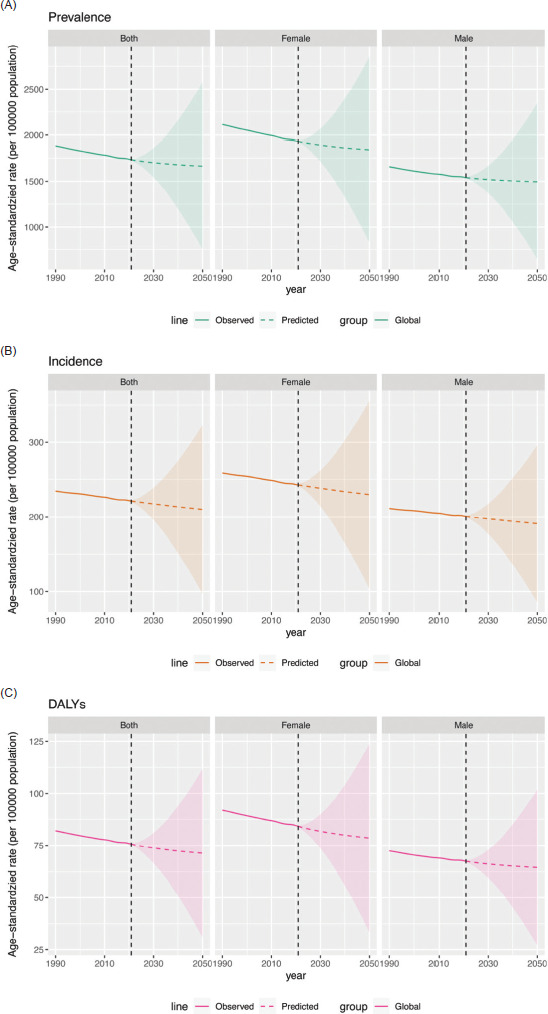
Based on data from 1990 to 2021, this study projects declining trends in global AD ASPR, ASIR, and age-standardized DALYs by 2050. Specifically, the global ASPR is projected to decline from 1,734.34 in 2021 to 1,664.09 by 2050. In this context, females are expected to experience a more pronounced decline, decreasing from 1,934.83 in 2021 to 1,840.81 by 2050, while males are projected to experience a decline from 1,540.86 in 2021 to 1,495.08 by 2050. The global ASIR is also projected to decrease from 221.16 in 2021 to 210.01 by 2050, with females showing a more substantial reduction than males. In addition, global age-standardized DALYs are anticipated to decline from 75.71 in 2021 to 71.32 by 2050, with similar declines observed in both females and males, although the reduction is primarily driven by females (Figure 6).
Figure 6 Future forecasts of atopic dermatitis.
Discussion
Among all skin diseases, AD ranks first in terms of disease burden as measured by DALYs. To our knowledge, this is the first study to comprehensively detail the incidence and prevalence of AD from 1990 to 2021 at the global, regional, and national levels across 204 countries. This study provided important insights into the trends in the burden of AD across populations, ages, and regions, and underscores the need for implementing more effective and targeted preventive measures.
Our study indicates that trends in age-related AD are remarkably evident, demonstrating that prevalence and impact patterns vary across different age groups. Our study revealed that children aged 5–9 years had the highest age-specific prevalence and DALYs rates, while the under-5 age group also exhibited a high age-specific incidence. These findings underscore childhood as a critical period for the high prevalence of AD. A cross-sectional, web-based survey of pediatric patients (6 months to <18 years of age) conducted in 18 countries representing North America, Latin America, Europe, the Middle East/Eurasia, and East Asia demonstrated that the prevalence of AD peaks at less than 5 years of age and decreases with age,23 which is consistent with our findings. However, it is noteworthy that the prevalence increased again in the 85–89 years age group, and the incidence increased again in the 75–79 years age group, suggesting a bimodal pattern of AD in terms of epidemiological trends. Factors predisposing older adults to AD include the physiological changes associated with aging, particularly the decline in skin barrier function, dysregulation of innate immune cells, and skewed adaptive immune responses toward Th2.24,25 With the growing global population of elderly individuals, it is anticipated that the disease burden of AD will rise in terms of both individual and societal costs.26 The itching, pain from skin breakdown, and infections related to AD can reduce the quality of life and increase economic and public health burdens. Further knowledge about AD in the elderly is needed to establish reliable diagnostic and therapeutic approaches. Timely and adequate care can ensure a robust quality of life and mitigate the higher health care costs associated with hospitalization for severe AD. Detailed studies of the skin and immune system in older patients with AD are necessary to tailor treatment for these patients and to standardize their care more effectively.
Among 204 countries and territories, Qatar exhibited the steepest increase in AD prevalence, incidence, and DALYs. This surge is plausibly driven by synergistic environmental stressors—extreme heat, sustained humidity, and recurrent sandstorms that directly impair the epidermal barrier and amplify allergen sensitization—compounded by highly accessible dermatological services that enhance case detection.27 In contrast, Albania exhibited the sharpest decline, which may reflect both a comparatively lower burden of environmental triggers relative to coastal nations and attenuated diagnostic capacity or health care utilization, leading to systematic under-ascertainment of true disease burden relative to high-income settings.28 Addressing the rising burden of DALYs in low-income regions (Kenya) requires evidence-based health care strategies. Key approaches include: targeting resources toward high-DALY conditions such as infectious diseases and maternal and child health issues through cost-effective measures like vaccination campaigns, insecticide-treated net distribution, and improved water and sanitation; expanding community health worker networks to extend primary care, provide basic services, ensure health education, and provide referrals, especially in remote areas; and implementing behavior-change communication and health education to promote preventive practices in nutrition and hygiene, reducing preventable disease incidence.
Our findings indicate that the global prevalence of AD increased by 20% from 1990 to 2021. Conversely, the ASPR and ASIR for AD decreased. A salient finding of this study is the divergent trajectory between total case counts and ASRs, underscoring the necessity of distinguishing absolute burden from risk-adjusted burden. Continued growth in global AD cases is driven predominantly by population expansion and demographic aging, particularly in high-burden regions. Conversely, the plateaued or modest decline in ASRs signals an underlying epidemiological transition, plausibly reflecting improvements in living standards, hygiene, or disease management in certain populations. This growing burden strains health care financing. First, high-cost biologics should be restricted to severe, treatment-resistant cases, necessitating better patient stratification. Second, treatment guidelines should incorporate absolute outcomes (e.g., ARR and NNT) and explicitly recommend step-care approaches. Third, while sustained prevention is essential to maintain reduced incidence, health systems must also enhance specialized care and ensure selective use of novel therapies for critical patients. Telemedicine and self-management can improve efficiency for mild cases, while regional specialized centers could standardize care, control costs, and generate real-world evidence.
As the largest organ of the body, the skin functions as a mechanical barrier against toxins and ultraviolet light, as well as a natural barrier against water loss. Both of these barrier functions are significantly compromised by AD. A wide range of factors may trigger or contribute to AD, including genetic factors, family history, dietary choices, immune triggers, and environmental factors.29 The ongoing increase in the burden of AD underscores the need for more in-depth research into its pathogenesis. It is critical to examine whether factors such as increased intake of processed foods, greater exposure to pollutants, and heightened stress levels contribute to the rising incidence of AD.30 However, unfortunately, the GBD database does not include descriptions of these relevant risk factors.
Our study demonstrates that AD is a common skin disorder with significant geographical differences in age-standardized prevalence, incidence, and DALYs, which aligns with existing findings. Specifically, the high-income Asia Pacific, Central Asia, and Western Europe regions exhibited the highest age-standardized prevalence, incidence, and DALYs of AD. Within these regions, Japan, France, and Kazakhstan were identified as the top three countries in terms of age-standardized prevalence, incidence, and DALYs. These findings indicate that these regions bear the highest burden of AD, particularly with Japan exhibiting the highest documented age-standardized prevalence, incidence, and DALYs. This disparity may mirror genuine pathophysiological heterogeneity, diagnostic artifact, or an admixture of both. Plausible drivers encompass (i) genetic architecture, notably the distinct spectrum and population-specific frequency of filaggrin loss-of-function variants across East Asian cohorts;31 (ii) environmental exposures, exemplified by Japan’s elevated aeroallergen load and sustained atmospheric humidity;32 and (iii) sociocultural and health care–system determinants—heightened dermatologic vigilance, habitual high-frequency bathing, and universal access to specialist services—collectively enhancing detection and registration of mild phenotypes and thereby inflating reported incidence.33 Collectively, Japan’s elevated AD burden is best conceptualized as the convergent outcome of genetic susceptibility, environmental triggers, behavioral norms, and ascertainment bias, rather than a straightforward indicator of true disease load. Prospective, individual-level investigations integrating high-resolution genomic and exposomic data are now imperative to disaggregate these contributions. Conversely, Eastern Europe experienced the largest increase in DALYs, suggesting a growing burden of AD in this region. This increase may be attributed to several factors. Firstly, environmental pollution, particularly in highly industrialized and polluted regions, is a significant contributor. Numerous global studies have shown exacerbated symptoms of chronic inflammatory dermatoses in both adult and child subjects exposed to high levels of pollution.34–36 Secondly, the higher prevalence of obesity in these regions can predispose individuals to exacerbate AD. Although the precise molecular mechanisms underlying the association between obesity and AD have not been fully elucidated, accumulating evidence points to three interrelated pathophysiological pathways. First, the Janus kinase (JAK) signal transducer and activator of transcription (STAT) signaling cascade play a pivotal role in transducing both metabolic and immunological signals relevant to the pathogenesis of both conditions. Second, hypertrophic adipose tissue releases a spectrum of soluble mediators—including pro-inflammatory cytokines (TNF-α, IL-6, IL-4, and IL-13), chemokines, adipokines (leptin, adiponectin, and resistin), and peroxisome proliferator-activated receptor gamma (PPAR-γ)—that collectively establish a chronic, low-grade systemic inflammatory state, thereby facilitating the initiation and exacerbation of AD, particularly in children and the elderly. Finally, obesity-induced gut microbial dysbiosis perturbs the composition and metabolic output of the microbiota, promoting a Th2-dominant inflammatory response that augments skin inflammation.37–39
The present study demonstrates that age-standardized prevalence, incidence, and DALYs have consistently been the highest in high SDI areas over a period exceeding three decades, although their estimated EAPC shows a decreasing trend. We document the co-occurrence of rising AD prevalence and declining age-standardized DALYs in high-income settings. This paradox is reconciled by four interacting mechanisms: (i) broadened diagnostic criteria leading to increased ascertainment of mild disease; (ii) therapeutic innovation, exemplified by biologic agents that substantially attenuate morbidity; (iii) demographic transition characterized by falling fertility and a shrinking pediatric denominator; and (iv) surveillance artifact stemming from enhanced health care infrastructure that now systematically records less severe phenotypes. However, this supports the notion that AD remains a significant public health concern in developed regions. Notably, the EAPC was highest in middle and high SDI regions, indicating a gradual increase in the burden of AD in these areas. These regions share common characteristics such as high health coverage and a high likelihood of diagnosis and reporting of AD. In addition, factors such as dietary habits, lifestyle, high work or study stress, and the obesity epidemic in high-income countries may contribute to the high burden in these regions. Conversely, age-standardized prevalence, incidence, and DALYs of AD were the lowest in low SDI regions. This can be attributed to the economic underdevelopment, low income levels, and shortage of dermatologists and medications in these areas, which collectively affect health care coverage. In sub-Saharan Africa, for instance, there is an average of 1 dermatologist per 10,000 to 20,000 people, and diagnostic dermatopathology is limited.40,41 Robust evidence confirms that individuals in this region concurrently confront a synergistic cluster of AD risk determinants, encompassing poverty, overcrowded housing, malnutrition, psychological stress, and inadequate access to clean water and basic sanitation.42 These factors can lead to underreporting of AD cases. Consequently, future research must prioritize rigorously targeted, community-based participatory research (CBPR) approaches that systematically engage these “hidden” populations to generate evidence for equitable and effective public health interventions.
Our study also revealed that globally, the age-standardized prevalence, incidence, and DALYs of AD were higher in women than in men. This gender disparity may be attributed to several factors, including fluctuations in sex hormone levels and imbalances in skin barrier function. Notably, hormonal changes during puberty, menstruation, and pregnancy can exacerbate AD in women.43 In addition, it is crucial to consider the gender-specific psychological and psychiatric effects of AD.44 Therefore, health care providers should adopt a holistic approach to treating AD, addressing both physical and emotional aspects. Tailored treatment programs that account for gender-specific needs and concerns can enhance treatment outcomes for AD and improve patients’ quality of life, particularly for pregnant women. Although substantial research has been conducted on the immunological mechanisms of AD, many questions remain unresolved. Significant advancements have been made with the introduction of novel, topical, and biological therapies, which have greatly enhanced patient care and improved the quality of life for those affected. In spite of these advancements, there remains a need for more personalized treatments and the identification of specific biomarkers (e.g., serum or plasma biomarkers). This area of research provides a new avenue for monitoring disease progression, understanding its trajectory, and assessing the effectiveness of specified therapies for different patient characteristics. The potential discovery of such biomarkers could revolutionize our understanding of the pathogenesis of AD, leading to better patient outcomes, improved treatments, and early diagnosis and prevention.
Our projections indicate that global age-standardized prevalence, incidence, and DALYs attributable to AD will decline markedly by 2050, a trend plausibly driven by concurrent advances in therapeutics, population level, public health interventions, and rising health literacy. Nevertheless, although the BAPC model efficiently handles high-dimensional epidemiological data, the absence of external validation for long-term forecasts limits its predictive validity. Strengthening sentinel data systems to monitor real-world trajectories is therefore imperative to ensure that reductions in the global burden of AD are both sustained and equitably distributed.
Our study acknowledges several limitations, particularly those inherent to the GBD 2021 database, which were considered in our analysis. First, diagnosing AD is particularly challenging in regions with limited access to health care, potentially leading to underdiagnosis or misdiagnosis, especially among individuals with low income levels. Second, variations in data quality across regions may lead to inconsistencies in reported AD rates. Areas with well-developed health care systems tend to report higher rates of AD, whereas remote and impoverished regions may underreport because of limited health care resources. This study did not account for potential variations in diagnostic criteria for AD across regions and over time, which may introduce bias in trend interpretation. Third, differences in diagnostic criteria across regions may introduce bias into the reported data. Finally, the database lacks information on risk factors for AD, which limits the comprehensiveness of the disease burden analysis. Therefore, future research should prioritize incorporating the psychological and psychiatric impact of AD to provide a more holistic understanding of the disease.
In summary, global AD prevalence and DALYs continue to rise, whereas ASPR and DALYs are declining. High SDI regions exhibit the highest prevalence, yet low-income countries show increasing age-standardized DALYs, underscoring profound regional heterogeneity. Thus, the absolute burden of AD is escalating worldwide, while individual-level risk appears to be improving. These persistent inequities represent a critical challenge for global health. Addressing them will require a comprehensive strategy that integrates clinical care, psychosocial support, and public health initiatives tailored to specific regional, demographic, and sex-based needs. Future research should focus on clarifying pathogenic mechanisms, identifying modifiable risk factors, and developing scalable interventions—all with the explicit goal of preventing further widening of global health gaps.
Ethics Approval
Not applicable.
Availability of Data and Materials
GBD study 2021 data resources were available online from the Global Health Data Exchange (GHDx) query tool (http://ghdx.healthdata.org/gbd-results-tool).
Authors’ Consent for Publication
The Author confirms: that the work described has not been published before; that it is not under consideration for publication elsewhere.
Mandatory Disclosure on Use of Artificial Intelligence
The authors declare that no AI-assisted tools were used in the preparation of this manuscript. All references have been manually verified for accuracy and relevance.
Author Contributions
All authors have made significant contributions to this study. Yaju Duan participated in the study design and conception, and drafted the initial manuscript. Xiaosong Zheng were responsible for the collection and organization of the data, and provided a detailed description and statistical analysis of the data. All authors participated in the writing of the paper and content revision, and agreed to submit the final version of the paper. The authors declare that all content in this manuscript, including images and tables, has not been previously published.
Conflicts of Interest
The authors declare they have no conflicts of interest.
Funding
This research received no specific grant from any funding agency in the public, commercial, or not-for-profit sectors.
REFERENCES
1 Drucker AM, Wang AR, Li WQ, Sevetson E, Block JK, Qureshi AA. The burden of atopic dermatitis: summary of a report for the National Eczema Association. J. Invest. Dermatol. 2017;137(1):26–30. 10.1016/j.jid.2016.07.012
2 Chiesa Fuxench ZC, Block JK, Boguniewicz M, et al. Atopic dermatitis in America study: a cross-sectional study examining the prevalence and disease burden of atopic dermatitis in the US adult population. J. Invest. Dermatol. 2019;139(3):583-590. 10.1016/j.jid.2018.08.028
3 Laughter MR, Maymone MBC, Mashayekhi S, et al. The global burden of atopic dermatitis: lessons from the Global Burden of Disease Study 1990–2017*. Accessed August 18, 2025. 10.1111/bjd.19580
4 Laughter MR, Maymone MBC, Mashayekhi S, et al. The global burden of atopic dermatitis: lessons from the Global Burden of Disease Study 1990–2017. Br. J. Dermatol. 2021;184(2):304–309. 10.1111/bjd.19580
5 Atopic dermatitis in older patients: particular points - PubMed. Accessed June 19, 2025. https://pubmed.ncbi.nlm.nih.gov/20569298/
6 Tanei R, Hasegawa Y. Atopic dermatitis in older adults: a viewpoint from geriatric dermatology. Geriatr. Gerontol. Int. 2016;16(Suppl 1):75–86. 10.1111/ggi.12771
7 Chiricozzi A, Maurelli M, Calabrese L, Peris K, Girolomoni G. Overview of atopic dermatitis in different ethnic groups. J. Clin. Med. 2023;12(7):2701. 10.3390/jcm12072701
8 Wollenberg A, Kinberger M, Arents B, et al. European guideline (EuroGuiDerm) on atopic eczema: part I-systemic therapy. J. Eur. Acad. Dermatol. Venereol. 2022;36(9):1409–1431. 10.1111/jdv.18345
9 Atopic dermatitis: economic burden and strategies for high-quality care | Br. J. Dermatol. | Oxford Academic. Accessed August 18, 2025. https://academic.oup.com/bjd/article-abstract/182/5/1087/6603166?redirectedFrom=fulltext&login=false
10 Kahn D, Iturriaga C, Bertran K, et al. Sleep quality in children with atopic dermatitis during flares and after treatment. Sleep Sci. Sao Paulo Braz. 2020;13(2):172–175. 10.5935/1984-0063.20190139
11 Drucker AM, Wang AR, Li WQ, Sevetson E, Block JK, Qureshi AA. The burden of atopic dermatitis: summary of a report for the National Eczema Association. J Invest Dermatol. 2017;137(1):26–30. 10.1016/j.jid.2016.07.012
12 Maurelli M, Chiricozzi A, Peris K, Gisondi P, Girolomoni G. Atopic dermatitis in the elderly population. Acta. Derm. Venereol. 2023;103:adv13363. 10.2340/actadv.v103.13363
13 DaVeiga SP. Epidemiology of atopic dermatitis: a review. Allergy Asthma Proc. 2012;33(3):227–234. 10.2500/aap.2012.33.3569
14 Kim JP, Chao LX, Simpson EL, Silverberg JI. Persistence of atopic dermatitis (AD): a systematic review and meta-analysis. J. Am. Acad. Dermatol. 2016;75(4):681–687.e11. 10.1016/j.jaad.2016.05.028
15 Financial Burden of Atopic Dermatitis Out-of-Pocket Health Care Expenses in the United States—PubMed. Accessed June 19, 2025. https://pubmed.ncbi.nlm.nih.gov/33323748/
16 Elezbawy B, Kaló Z, Fasseeh A, Inotai A, Nemeth B, Ágh T. The hidden burden of atopic dermatitis in central and Eastern European countries. Expert Rev. Pharmacoecon. Outcomes Res. 2025;25(2):257–264. 10.1080/14737167.2024.2416249
17 Mohr N, Naatz M, Zeervi L, et al. Cost-of-illness of atopic dermatitis in Germany: data from dermatology routine care. J. Eur. Acad. Dermatol. Venereol. 2021;35(6):1346–1356. 10.1111/jdv.17203
18 GBD 2019 diseases and injuries collaborators. Global burden of 369 diseases and injuries in 204 countries and territories, 1990–2019: a systematic analysis for the global burden of disease study 2019. Lancet. Lond. Engl. 2020;396(10258):1204–1222. 10.1016/S0140-6736(20)30925-9
19 Stevens GA, Alkema L, Black RE, et al. Correction: guidelines for accurate and transparent health estimates reporting: the GATHER statement. PLoS Med. 2016;13(8):e1002116. 10.1371/journal.pmed.1002116
20 GBD 2019 demographics collaborators. Global age-sex-specific fertility, mortality, healthy life expectancy (HALE), and population estimates in 204 countries and territories, 1950–2019: a comprehensive demographic analysis for the global burden of disease study 2019. Lancet Lond. Engl. 2020;396(10258):1160–1203. 10.1016/S0140-6736(20)30977-6
21 Knoll M, Furkel J, Debus J, Abdollahi A, Karch A, Stock C. An R package for an integrated evaluation of statistical approaches to cancer incidence projection. BMC Med. Res. Methodol. 2020;20(1):257. 10.1186/s12874-020-01133-5
22 GBD 2021 causes of death collaborators. Global burden of 288 causes of death and life expectancy decomposition in 204 countries and territories and 811 subnational locations, 1990–2021: a systematic analysis for the global burden of disease study 2021. Lancet Lond. Engl. 2024;403(10440):2100–2132. 10.1016/S0140-6736(24)00367-2
23 Weidinger S, Simpson EL, Silverberg JI, et al. Burden of atopic dermatitis in paediatric patients: an international cross-sectional study. Br. J. Dermatol. 2024;190(6):846–857. 10.1093/bjd/ljad449
24 Tight junctions/adherens junctions: basic structure and function—PubMed. Accessed June 20, 2025. https://pubmed.ncbi.nlm.nih.gov/17934504/
25 Innate immunity and inflammation in ageing: a key for understanding age-related diseases—PubMed. Accessed June 20, 2025. https://pubmed.ncbi.nlm.nih.gov/15904534/
26 Williamson S, Merritt J, De Benedetto A. Atopic dermatitis in the elderly: a review of clinical and pathophysiological hallmarks. Br. J. Dermatol. 2020;182(1):47–54. 10.1111/bjd.17896
27 Kantor R, Silverberg JI. Environmental risk factors and their role in the management of atopic dermatitis. Expert Rev. Clin. Immunol. 2017;13(1):15–26. 10.1080/1744666X.2016.1212660
28 Aguilera AC, Dagher IA, Kloepfer KM. Role of the microbiome in allergic disease development. Curr. Allergy Asthma Rep. 2020;20(9):44. 10.1007/s11882-020-00944-2
29 Faraz K, Seely M, Marano AL. The role of the environment in allergic skin disease. Curr. Allergy Asthma Rep. 2024;24(6):323–330. 10.1007/s11882-024-01147-9
30 Afshari M, Kolackova M, Rosecka M, Čelakovská J, Krejsek J. Unraveling the skin; a comprehensive review of atopic dermatitis, current understanding, and approaches. Front. Immunol. 2024;15:1361005. 10.3389/fimmu.2024.1361005
31 Taguchi N, Hata T, Kamiya E, Kobayashi A, Aoki H, Kunisada T. Reduction in human hair graying by sterubin, an active flavonoid of Eriodictyon angustifolium. J. Dermatol. Sci. 2018;92(3):286–289. 10.1016/j.jdermsci.2018.11.002
32 Furue M, Chiba T, Tsuji G, et al. Atopic dermatitis: immune deviation, barrier dysfunction, IgE autoreactivity and new therapies. Allergol. Int. Off. J. Jpn. Soc. Allergol. 2017;66(3):398-403. 10.1016/j.alit.2016.12.002
33 Abernethy AP, McDonald CF, Frith PA, et al. Effect of palliative oxygen versus room air in relief of breathlessness in patients with refractory dyspnoea: a double-blind, randomised controlled trial. Lancet Lond. Engl. 2010;376(9743):784–793. 10.1016/S0140-6736(10)61115-4
34 Li A, Fan L, Xie L, Ren Y, Li L. Associations between air pollution, climate factors and outpatient visits for eczema in West China Hospital, Chengdu, south-western China: a time series analysis. J. Eur. Acad. Dermatol. Venereol. 2018;32(3):486–494. 10.1111/jdv.14730
35 Belugina IN, Yagovdik NZ, Belugina OS, Belugin SN. Outdoor environment, ozone, radionuclide-associated aerosols and incidences of infantile eczema in Minsk, Belarus. J. Eur. Acad. Dermatol. Venereol. 2018;32(11):1977–1985. 10.1111/jdv.15063
36 Kim YM, Kim J, Jung K, Eo S, Ahn K. The effects of particulate matter on atopic dermatitis symptoms are influenced by weather type: application of spatial synoptic classification (SSC). Int. J. Hyg. Environ. Health. 2018;221(5):823–829. 10.1016/j.ijheh.2018.05.006
37 Yang S, Zhu T, Wakefield JS, Mauro TM, Elias PM, Man MQ. Link between obesity and atopic dermatitis: does obesity predispose to atopic dermatitis, or vice versa? Exp. Dermatol. 2023;32(7):975–985. 10.1111/exd.14801
38 Zhang S, Zhang B, Liu Y, Li L. Adipokines in atopic dermatitis: the link between obesity and atopic dermatitis. Lipids Health Dis. 2024;23(1):26. 10.1186/s12944-024-02009-z
39 Shang D, Zhao S. Molecular mechanisms of obesity predisposes to atopic dermatitis. Front. Immunol. 2024;15:1473105. 10.3389/fimmu.2024.1473105
40 Al-Afif KAM, Buraik MA, Buddenkotte J, et al. Understanding the burden of atopic dermatitis in Africa and the Middle East. Dermatol. Ther. 2019;9(2):223–241. 10.1007/s13555-019-0285-2
41 Schmid-Grendelmeier P, Takaoka R, Ahogo KC, et al. Position statement on atopic dermatitis in sub-Saharan Africa: current status and roadmap. J. Eur. Acad. Dermatol. Venereol. 2019;33(11):2019–2028. 10.1111/jdv.15972
42 Pavli A, Maltezou H. Health problems of newly arrived migrants and refugees in Europe. J. Travel Med. 2017;24(4). 10.1093/jtm/tax016
43 Kanda N, Hoashi T, Saeki H. The roles of sex hormones in the course of atopic dermatitis. Int. J. Mol. Sci. 2019;20(19):4660. 10.3390/ijms20194660
44 Hong J, Koo B, Koo J. The psychosocial and occupational impact of chronic skin disease. Dermatol Ther. 2008;21(1): 54–59. 10.1111/j.1529-8019.2008.00170.x
Supplementary
Table S1 Two hundred and four nations/territories trends in AD burden of prevalence (1990-2021)..
| Location | Number 1990 | ASR 1990 | Number 2021 | ASR 2021 | EAPC_95%CI |
|---|---|---|---|---|---|
| Afghanistan | 171727.64 (161821.16-181570.59) | 1355.66 (1284.24-1430.77) | 566480.5 (533907.48-599537.8) | 1350.54 (1279.81-1425.72) | -0.01 (-0.01 to -0.01) |
| Albania | 67516.98 (63719.99-71288.98) | 1795.49 (1696.79-1894.08) | 34109.23 (32494.58-35701.43) | 1797.12 (1697.98-1895.48) | 0 (-0.01 to 0) |
| Algeria | 440090.32 (400253.55-482314.94) | 1349.23 (1233.78-1470.54) | 611784.95 (559462.26-666965.73) | 1348.44 (1233.05-1469.49) | -0.02 (-0.03to -0.01) |
| American | 1009.58 (953.6-1075.76) | 1727.48 (1634.68-1835.49) | 853.12 (803.34-908.43) | 1728.01 (1634.81-1836.11) | 0 (0 to 0) |
| Samoa | |||||
| Andorra | 1451.3 (1388.67-1514.78) | 3362.41 (3200.75-3512.86) | 1929.19 (1851.11-2010.08) | 3373.14 (3211.25-3523.86) | 0.01 (0.01 to 0.01) |
| Angola | 133631.95 (124932.53-141686.48) | 984.02 (922.6-1039.22) | 437318.33 (408660.11-464087.04) | 986.2 (924.56-1041.51) | 0.01 (0.01 to 0.01) |
| Antigua and | 1215.98 (1146.5-1281.54) | 1949.45 (1844.25-2051.18) | 1447.87 (1370.87-1523.89) | 1945.85 (1840.88-2047.34) | -0.01 (-0.01 to -0.01) |
| Barbuda | |||||
| Argentina | 1099821.55 (1036753.22-1162926.26) | 3214.17 (3034.41-3397.61) | 1299149.88 (1227391.69-1371441.39) | 3211.48 (3031.98-3394.53) | 0 (0 to 0) |
| Armenia | 158192.72 (149386.36-167029.65) | 4398.68 (4158.21-4640.95) | 104475.87 (99114.27-109849.16) | 4383.2 (4144.06-4625.7) | -0.02 (-0.02 to -0.01) |
| Australia | 34 8274.72 (325542.51-3692 83.33) | 2365.21 (2208.64-2515.47) | 475877.44 (445730.46-505224.64) | 2362.08 (2209.25-2526.64) | 0 (-0.01 to 0.01) |
| Austria | 20 9724.21 (20 0745.22-218510.2) | 3377.47 (3216.66-3529.64) | 222062.25 (213062.03-231011.14) | 3372.32 (3211.09-3523.92) | 0 (-0.01 to 0) |
| Azerbaijan | 360430.31 (339686.93-380857.49) | 4402.67 (4162.19-4645.18) | 393111.67 (371910.33-413908.15) | 4371.03 (4132.09-4613.17) | -0.03 (-0.03 to -0.03) |
| Bahamas | 5275.71 (4969.58-5569.44) | 1948.14 (1843.16-2049.83) | 6537.97 (6178.35-6896.07) | 1948.8 (1843.8-2050.52) | 0 (0 to 0) |
| Bahrain | 7388.97 (6992.47-7819.17) | 1344.77 (1274.22-1419.92) | 16952.37 (16104.38-17842.4) | 1340.11 (1269.58-1415.3) | -0.02 (-0.02 to -0.01) |
| Bangladesh | 2188391.42 (2052681.02-2327509.98) | 1463.7 (1378.48-1550.75) | 2389711.93 (2247551.55-2534709.17) | 1466.63 (1381.03-1553.54) | 0.01 (0.01 to 0.01) |
| Barbados | 4627.42 (4374.76-4871.99) | 1948.26 (1843.23-2050.05) | 4535.65 (4298.71-4768.24) | 1945.43 (1840.46-2046.87) | 0 (-0.01 to 0) |
| Belarus | 177658.87 (170996.01-184593.65) | 1943.29 (1867.15-2021.12) | 129859.32 (125306.15-134508.4) | 1936.16 (1860.26-2013.45) | -0.01 (-0.01 to -0.01) |
| Belgium | 271045.63 (259530-282396.67) | 3376.5 (3215.36-3528.48) | 298810.47 (286606.05-311179.17) | 3377.15 (3215.77-3528.91) | 0 (0 to 0) |
| Belize | 4585.14 (4314.19-4858.93) | 1944.63 (1839.79-2045.86) | 8417.03 (7939.84-8885.58) | 1946.46 (1841.34-2047.88) | 0 (0 to 0) |
| Benin | 68528.27 (65008.65-71956.02) | 1042.38 (996.1-1089.41) | 180529.99 (171479.66-189479.52) | 1042.3 (995.94-1089.44) | 0 (0 to 0) |
| Bermuda | 988.31 (934.33-1038.04) | 1947.73 (1842.81-2049.41) | 905.17 (860.98-950.61) | 1946.24 (1841.27-2047.66) | 0 (0 to 0) |
| Bhutan | 12008.81 (11254.32-12772.21) | 1461.75 (1376.87-1550.12) | 10221.35 (9612.8-10830.71) | 1464.87 (1379.49-1552.51) | 0.01 (0 to 0.01) |
| Bolivia | 131748.65 (12 5425.5-1384 43.04) | 1702.5 (1627.52-1783.5) | 204121.75 (194838.62-214016.4) | 1700.52 (1625.67-1781.64) | 0 (0 to 0) |
| (Plurinational State of) | |||||
| Bosnia and | 72811.55 (68958.96-76736.35) | 1802.96 (1703.9-1902.14) | 39303.21 (37475.52-41125.08) | 1801.69 (1702.66-1900.84) | -0.01 (-0.01 to 0) |
| Herzegovina | |||||
| Botswana | 17990.61 (16900.65-19181.95) | 1039.19 (981.21-1104.55) | 25215.46 (23777.57-26838.72) | 1036.68 (978.53-1101.39) | -0.01 (-0.01 to -0.01) |
| Brazil | 3854426.92 (3689020.85-4027939.38) | 2361.53 (2269.63-2460.88) | 4665945.42 (4493335.09-4851830.98) | 2363.7 (2271.91-2463.95) | 0 (-0.01 to 0) |
| Brunei | 11268.96 (10650.18-11936.84) | 3824.15 (3624.8-4042.49) | 14744.7 (13998.6-15562.24) | 3823.19 (3624.54-4041.61) | -0.01 (-0.01 to 0) |
| Darussalam | |||||
| Bulgaria | 122449 (116324.62-128578.1) | 1803.76 (1704.67-1903.19) | 78406.68 (74803.81-82083.56) | 1800.75 (1701.71-1899.8) | -0.01 (-0.01 to -0.01) |
| Burkina Faso | 133222.94 (126371.97-139924.52) | 1043.42 (997.07-1090.6) | 305770.15 (290467.96-320927.18) | 1043.59 (997.16-1090.72) | 0 (0 to 0) |
| Burundi | 71579.15 (67881.06-75144.51) | 987.37 (943.07-1033.66) | 165862.52 (157383.11-174276.01) | 985.51 (941.15-1031.92) | -0.01 (-0.01 to -0.01) |
| Cabo Verde | 4717.12 (4482.02-4951.52) | 1045.06 (998.76-1092.37) | 5550.46 (5308.1-5797.52) | 1040.74 (994.53-1087.81) | -0.01 (-0.01 to -0.01) |
| Cambodia | 220180.93 (207315.64-232282.61) | 1661.51 (1572.41-1748.6) | 289403.68 (273622.48-304912.15) | 1641.82 (1555.1-1727.78) | -0.04 (-0.04 to -0.03) |
| Cameroon | 169027.93 (161220.81-177386.46) | 1249.61 (1197.67-1304.75) | 489199.01 (465106.39-515445.49) | 1246.75 (1190.18-1306.11) | 0.03 (0.01 to 0.04) |
| Canada | 711243.54 (684804.84-739755.44) | 2856.58 (2749-2973.78) | 921056.86 (890689.97-956797.64) | 2855.17 (2747.9-2972.52) | 0 (0 to 0) |
| Central African | 35144.67 (32857.29-37254.55) | 985.01 (923.47-1040.33) | 68142.04 (63712.43-72221.7) | 985.2 (923.69-1040.35) | 0 (0 to 0) |
| RepublicChad | 83343.45 (79138.74-87511.37) | 1043.5 (997.11-1090.77) | 253930.63 (240841.21-266897.87) | 1041.13 (994.84-1088.49) | -0.01 (-0.01 to -0.01) |
| Chile | 440669.07 (415508.38-465456.46) | 3213.67 (3034.14-3396.86) | 500007.41 (472995.76-527135.89) | 3208.04 (3028.48-3390.95) | 0 (0 to 0) |
| China | 15921267.11 (15232998.69-16614704.86) | 1357.93 (1298.98-1417.71) | 15420512.86 (14839161-16004107.07) | 1347.11 (1288.65-1402.16) | 0 (-0.02 to 0.02) |
| Colombia | 694458.92 (653787.7-735068) | 1879.99 (1774.65-1987.47) | 808091.58 (765629.81-851964.8) | 1877.87 (1772.21-1984.99) | 0 (0 to 0) |
| Comoros | 5899.22 (5597.29-6198.38) | 985.6 (941.35-1031.79) | 7866.17 (7498.99-8265.5) | 985.02 (940.88-1031.18) | 0 (0 to 0) |
| Congo | 24923.05 (22790.69-26959.49) | 789.68 (726.57-849.72) | 49068.04 (44914.1-52956.94) | 788.56 (725.3-848.5) | -0.02 (-0.04 to -0.01) |
| Cook Islands | 369.65 (348.74-393.93) | 1725.4 (1632.67-1833.65) | 263.39 (249.91-278.95) | 1737.11 (1644.05-1845.35) | 0.02 (0.02 to 0.03) |
| Costa Rica | 66217.07 (62279.01-70066.5) | 1877.64 (1772.3-1984.91) | 77846.49 (73648.14-82141.51) | 1880.18 (1774.56-1987.54) | 0.01 (0.01 to 0.01) |
| Croatia | 69501.33 (65991.76-72999.81) | 1804.14 (1705.13-1903.49) | 48514.46 (46301.43-50759.22) | 1801.58 (1702.53-1900.75) | -0.01 (-0.01 to -0.01) |
| Cuba | 195296.44 (184480.44-205648.33) | 1943.17 (1838.3-2044.36) | 170719.73 (162106.08-179422.23) | 1942.18 (1837.62-2043.4) | 0 (0 to 0) |
| Cyprus | 22104.32 (20186.36-24045.6) | 3042.6 (2773.83-3313.62) | 30958.79 (28591.53-33520.83) | 3043.36 (27 74.13-3314.61) | -0.01 (-0.02 to 0) |
| Czechia | 150084.38 (142563.57-157702.68) | 1804.63 (1705.53-1904.09) | 130835.8 (124488.27-137054.76) | 1801.04 (1701.99-1900.25) | -0.01 (-0.01 to -0.01) |
| Côte d'Ivoire | 166274.71 (157821.85-174401.75) | 1039.21 (993.03-1086.36) | 354282.07 (336817.36-371248.97) | 1038.25 (992.31-1085.4) | 0 (-0.01 to 0) |
| Democratic | 364421.72 (344137.5-384470.75) | 1754.08 (1658.38-1852.02) | 377053.51 (358588.42-396918) | 1745.08 (1648.62-1841.26) | -0.02 (-0.02 to -0.02) |
| People's Republic of Korea Democratic | 502692.41 (469836.33-533020.72) | 984.81 (923.3-1040.19) | 1132171.48 (1058385.81-1200256.32) | 983.82 (922.42-1038.9) | 0 (0 to 0) |
| Republic of the Congo Denmark | 178160.16 (164103.85-191464.11) | 4300.78 (3940.61-4648.98) | 197175.89 (182172.24-211782.91) | 4298.2 (3937.65-4646.22) | 0.05 (0.02 to 0.07) |
| Djibouti | 5041.49 (4786.79-5299.52) | 981.26 (937.3-1027.24) | 13261.66 (12639.68-13932.98) | 9 78.74 (935.11-1024.81) | -0.01 (-0.01 to -0.01) |
| Dominica | 1547.96 (1458.91-1634.39) | 1943.7 (1839.1-2045.3) | 1123.38 (1062.66-1183.38) | 1943.57 (1838.86-2044.83) | 0 (0 to 0) |
| Dominican | 161214.44 (151862.67-170422.16) | 1948.92 (1843.71-2050.53) | 207810.51 (196506.37-218595.08) | 1944.45 (1839.64-2045.76) | -0.01 (-0.01 to -0.01) |
| RepublicEcuador | 200550.09 (190894.34-211404.78) | 1729.91 (1655.25-1813.37) | 310335.13 (296826.69-325619.66) | 1728.94 (1654.14-1812.27) | 0 (0 to 0.01) |
| Egypt | 586427.08 (544556.82-627318.81) | 845.5 (786.86-902.15) | 1006429.06 (937920.3-1073204.13) | 833.6 (777.57-886.43) | -0.1 (-0.13 to -0.07) |
| El Salvador | 121459.69 (114160.16-128618.23) | 1881.21 (1775.67-1988.69) | 121443.07 (114547.72-128427.93) | 1881.17 (1775.09-1988.55) | 0 (0 to 0) |
| Equatorial | 5561.84 (5201.09-5894.53) | 985.48 (924.03-1040.74) | 18118.91 (16911.4-19223.49) | 977.39 (917.77-1031.56) | -0.03 (-0.03 to -0.03) |
| GuineaEritrea | 43774.05 (41540.92-45991.76) | 985.27 (941.29-1031.3) | 76360.84 (72663.62-80280.06) | 984.45 (940.56-1030.54) | 0 (0 to 0) |
| Estonia | 56 023.49 (53922.74-58296.34) | 4130.96 (3965.73-4306) | 38734.82 (37425.48-40282.28) | 4113.27 (3947.84-4287.48) | -0.04 (-0.05 to -0.02) |
| Eswatini | 11460.59 (10765.28-12222.71) | 1039.67 (981.66-1105.18) | 13750.57 (12935.12-14662.38) | 1036.49 (978.27-1101.16) | -0.01 (-0.01 to -0.01) |
| Ethiopia | 604685.69 (575471.49-635043.39) | 900.45 (861.85-943.73) | 1203676.02 (1146179.35-1265165.69) | 900.19 (861.51-943.42) | 0.07 (0.04 to 0.09) |
| Fiji | 15387.82 (14504.15-16411.46) | 1729.23 (1635.99-1837.51) | 16216.44 (15320.6-17238.93) | 1729.05 (1635.73-1837.38) | 0 (0 to 0) |
| Finland | 138652.52 (132684.98-144553.95) | 3378.06 (3217.21-3530.19) | 139701.57 (134027.28-145537.03) | 3374.64 (3213.28-3526.08) | 0 (0 to 0) |
| France | 2358620.39 (2205832.09-2525728.28) | 4703.81 (4397.52-5039.26) | 2519404.61 (2359682.63-2685248.19) | 4704.28 (4397.67-5039.86) | -0.04 (-0.06 to -0.02) |
| Gabon | 16152.62 (14991.4-17490.71) | 1315.99 (1226.24-1417.91) | 27304.56 (25212.82-29316.99) | 1313.16 (1219.23-1405.14) | -0.03 (-0.06 to 0) |
| Gambia | 13387.97 (12708.11-14049.76) | 1041.06 (994.74-1088.29) | 30588.83 (29091.01-32081.36) | 1042.07 (995.72-1089.25) | 0 (0 to 0.01) |
| Georgia | 221627.41 (210905.39-233335.94) | 4352.43 (4131.33-4582.52) | 127844.22 (121633.88-134467.35) | 4365.07 (4148.19-4609.71) | 0.03 (0.02 to 0.05) |
| Germany | 2138397.69 (2058504.94-2221596.41) | 3469.69 (3327.08-3620.55) | 2147967.79 (2064138.51-2239495.96) | 3460.05 (3298.4-3626.2) | -0.02 (-0.08 to 0.04) |
| Ghana | 165369.21 (157439.65-173311.01) | 859.29 (823.45-895.49) | 342904.5 (327359.24-358756.9) | 860.11 (824.34-896.31) | 0.07 (-0.04 to 0.17) |
| Greece | 250064.03 (231124.04-272239.17) | 2949.56 (2720.73-3201.36) | 210700.28 (194243.83-228540.54) | 2973.01 (2730.98-3244.68) | 0.04 (0.03 to 0.05) |
| Greenland | 1525.81 (1462.86-1589.41) | 2826.11 (2719.68-2943.71) | 1448.47 (1396.67-1506.86) | 2841.89 (2735.11-2960) | 0.02 (0.01 to 0.02) |
| Grenada | 1985.44 (1872.6-2099.74) | 1947.16 (1842.29-2048.83) | 1749.36 (1655.51-1841.51) | 1941.76 (1837.28-2042.97) | -0.01 (-0.02 to -0.01) |
| Guam | 2462 (2327.94-2618.12) | 1720.46 (1627.18-1828.03) | 2431.12 (2307.45-2575.91) | 1726.14 (1632.85-1834.36) | 0.01 (0 to 0.01) |
| Guatemala | 213258.29 (199530.19-226319.11) | 1881.96 (1776.49-1989.75) | 316554.47 (298213.41-335255.05) | 1881.69 (1775.93-1989.16) | 0 (0 to 0) |
| Guinea | 80097.92 (76080.25-84000.92) | 1042.45 (996.15-1089.64) | 179232.01 (170231.82-188149.92) | 1042.58 (996.22-1089.84) | 0 (0 to 0) |
| Guinea-Bissau | 13883.65 (13177.83-14583.74) | 1043.64 (997.25-1090.99) | 27074.25 (2 5728.31-283 88.74) | 1042.74 (996.41-1089.89) | 0 (0 to 0) |
| Guyana | 17462.71 (16457.91-18450.48) | 1948.17 (1843.21-2049.81) | 14791.87 (13964.9-15567.88) | 1946.39 (1841.43-2047.87) | 0 (0 to 0) |
| Haiti | 152647.24 (143852.31-161514.92) | 1951.4 (1845.83-2053.18) | 272523.61 (2 57033.71-287418.19) | 1947.8 (1842.62-2049.4) | -0.01 (-0.01 to -0.01) |
| Honduras | 117752.29 (110159.81-124836.93) | 1879.47 (1774.1-1986.8) | 205268.63 (193366.2-217359.68) | 1880.53 (1774.93-19 88.01) | 0 (0 to 0) |
| Hungary | 217953.93 (203611.33-232690.18) | 2628.81 (2449.61-2820.56) | 167812.08 (157942.05-178485.25) | 2622.78 (2444.24-2814.44) | -0.06 (-0.09 to -0.03) |
| Iceland | 9068.18 (8333.98-9832.56) | 3813 (3505.58-4127.68) | 10924.36 (10093.93-11764.49) | 3792.06 (3497.59-4100.35) | -0.03 (-0.04 to -0.02) |
| India | 15328141.51 (14569542.53-16163500.52) | 1467.5 (1399.68-1540.79) | 19719218.89 (18780827.09-20707984.55) | 1468.09 (1400.25-1541.41) | -0.03 (-0.04 to -0.01) |
| Indonesia | 3511824.44 (3350821.98-3679189.28) | 1639.17 (1568.08-1711.5) | 4253490.26 (4080284.56-4441074.55) | 1649.3 (1580.82-1723.76) | 0.03 (0.03 to 0.04) |
| Iran (Islamic Republic of) | 1153380.18 (1095613.62-1208555.86) | 1518.56 (1449.29-1581.75) | 1187976.71 (1133290.97-1243345.67) | 1538.6 (1466.98-1612) | 0.07 (0.06 to 0.09) |
| Iraq | 329920.93 (311005.59-349150.12) | 1349.93 (1279.29-1425.13) | 608116.62 (574493.5-643274.69) | 1349.58 (1278.89-1424.78) | 0 (0 to 0) |
| Ireland | 118865.45 (113352.5-124529.41) | 3376.83 (3215.57-3528.82) | 139020.49 (133130.5-145144) | 3378.93 (3217.45-3530.8) | 0 (0 to 0) |
| Israel | 175185.98 (166655.62-183392.06) | 3379.49 (3218.41-3531.53) | 316329.03 (301683.82-330451.91) | 3376.7 (3215.45-3528.44) | 0 (0 to 0) |
| Italy | 1856370.18 (1789083.62-1935803.42) | 4147.57 (3987.49-4324.21) | 1764991.06 (1704635.42-1835422.1) | 4141.92 (3982.12-4318.33) | -0.02 (-0.03 to -0.01) |
| Jamaica | 51727.27 (48739.84-54689.91) | 1948.13 (1842.96-2049.72) | 47526 (44977.42-50020.78) | 1945.33 (1840.37-2046.68) | -0.01 (-0.01 to 0) |
| Japan | 4953946.16 (4740555.3-5172739.46) | 4885.26 (4663.48-5118.21) | 4215539.66 (4066990.71-4381579.31) | 4892.58 (4683.9-5124.84) | -0.03 (-0.07 to 0.01) |
| Jordan | 65347.07 (59938.79-70392.77) | 1326.04 (1223.87-1423.8) | 168305.91 (155162.17-181917.75) | 1325.05 (1222.95-1422.86) | -0.01 (-0.02 to -0.01) |
| Kazakhstan | 774412.45 (730827.81-817846.1) | 4404.42 (4163.56-4646.81) | 822518.28 (778930.94-867900.34) | 4398.9 (4158.21-4641.02) | 0 (0 to 0) |
| Kenya | 257840.27 (246484.97-270472.04) | 834.33 (800.43-871.13) | 517425.81 (491395.63-542 883.15) | 880.76 (840.4-921.84) | 0.25 (0.21 to 0.28) |
| Kiribati | 1568.86 (1482.62-1671.75) | 1733.36 (1639.73-1841.65) | 2349.03 (2215.31-2501.49) | 1734.55 (1640.83-1843.05) | 0 (0 to 0) |
| Kuwait | 27041.09 (24702.13-29462.28) | 1432.71 (1313.23-1558.69) | 52718.97 (48116.41-57808.27) | 1426.21 (1308.13-1560.42) | -0.05 (-0.06 to -0.03) |
| Kyrgyzstan | 237519.45 (223656.26-251074.53) | 4403.33 (4162.29-4645.48) | 331047.64 (312317.2-349662.4) | 4395.71 (4155.15-4637.72) | 0 (-0.01 to 0) |
| Lao People's | 8727 7.74 (82233.58-92050.53) | 1651.19 (1562.7-1738.04) | 128318.43 (121242.01-135246.41) | 1639.92 (1552.76-1725.89) | -0.02 (-0.02 to -0.02) |
| Democratic Republic | |||||
| Latvia | 19449.39 (18678.63-20220.62) | 876.07 (837.34-913.75) | 11111.26 (10710.23-11502.86) | 871.63 (836.42-907.33) | -0.01 (-0.02 to -0.01) |
| Lebanon | 45572.33 (43060-48142.38) | 1351.51 (1280.62-1426.67) | 66382.62 (63001.76-69798.7) | 1349.3 (1278.67-1424.32) | -0.01 (-0.01 to 0) |
| Lesotho | 20648.29 (19403.82-21996.34) | 1041.35 (983.64-1107.11) | 21702.89 (20412.09-23157.46) | 1038.02 (979.9-1102.96) | -0.01 (-0.01 to -0.01) |
| Liberia | 33163.31 (31498.18-34779.15) | 1040.91 (994.6-1088.18) | 68065.11 (64787.62-71349.6) | 1039.84 (993.69-1086.98) | -0.01 (-0.01 to -0.01) |
| Libya | 73687.68 (69383.12-77993.37) | 1350.98 (1280.21-1426.23) | 80903.53 (76681.1-85311.91) | 1350.5 (1279.81-1425.72) | -0.01 (-0.01 to 0) |
| Lithuania | 61982.14 (59698.59-64386.36) | 1942.31 (1866.13-2020.06) | 36197.78 (34970.14-37427.15) | 1935.98 (1859.99-2013.33) | -0.01 (-0.01 to -0.01) |
| Luxembourg | 10148.66 (9720.72-10567.59) | 3376.93 (3216.09-3529.06) | 16311 (15645.22-16958.04) | 3372.46 (3211.04-3524.12) | 0 (-0.01 to 0) |
| Madagascar | 151201.34 (143546.87-158759.62) | 985.35 (941.01-1031.52) | 346225.15 (328870.78-363993.08) | 986.11 (941.76-1032.36) | 0 (0 to 0) |
| Malawi | 124685.79 (118356.88-130841.83) | 986.61 (942.28-1032.93) | 239284.89 (226971.9-251672.26) | 987.27 (942.81-1033.71) | 0 (0 to 0) |
| Malaysia | 338113.32 (319101.16-356857.61) | 1640 (1553.02-1726.06) | 483091.8 (457900.89-508354.72) | 1630.76 (1544.92-1716.15) | -0.02 (-0.02 to -0.02) |
| Maldives | 4884.94 (4595.31-5156.03) | 1636.81 (1549.34-1722.72) | 6787.71 (6445.81-7133.39) | 1590.87 (1507.49-1672.41) | -0.11 (-0.13 to -0.09) |
| Mali | 129 744.16 (120652.25-138634.44) | 1152.05 (1071.04-1228.74) | 365357.75 (338500.4-391224.8) | 1146.01 (1070.13-1221.81) | -0.02 (-0.03 to -0.02) |
| Malta | 11265.27 (10758.4-11761.79) | 3376.57 (3215.42-3528.39) | 10931.54 (10489.3-11375.13) | 3370.11 (3208.82-3521.71) | -0.01 (-0.01 to -0.01) |
| Marshall Islands | 1082.21 (1017.45-1158.68) | 1728.6 (1635.55-1836.88) | 1022.98 (965.04-1088.26) | 1727.86 (1634.66-1836.18) | 0 (0 to 0) |
| Mauritania | 27318.04 (25956.75-28657.48) | 1041.52 (995.25-1088.58) | 56601.9 (53814.99-59383.99) | 1041.97 (995.63-1089.17) | 0 (0 to 0) |
| Mauritius | 18639.65 (17595.75-19637.52) | 1640.42 (1553.18-1726.32) | 16195.49 (15394.87-17009.73) | 1641.06 (1553.66-1727.1) | 0 (0 to 0) |
| Mexico | 1648613.85 (1568231.22-1723361.29) | 1604.64 (1534.21-1674.77) | 1895386.7 (1811194.93-1980156.23) | 1575.14 (1504.27-1644.57) | -0.08 (-0.09 to -0.07) |
| Micronesia | 2331.58 (2193.36-2491.66) | 1728.33 (1635.51-1836.57) | 1832.82 (1728.73-1949.36) | 1727.76 (1634.48-1836) | 0 (0 to 0) |
| (Federated States of) Monaco | 698.76 (671.04-727.42) | 3373.98 (3213.08-3525.88) | 905.61 (870.22-943.76) | 3382.85 (3221.18-3534.37) | 0.01 (0.01 to 0.01) |
| Mongolia | 122977.22 (115591.72-130157.05) | 4392.96 (4152.23-4634.58) | 158855.95 (150092.28-167784.16) | 4396.36 (4155.8-4638.41) | 0 (0 to 0) |
| Montenegro | 10521.8 (9958.76-11096.84) | 1802.82 (1703.74-1902.07) | 8216.08 (7810.05-8617.47) | 1799.52 (1700.47-1898.3) | -0.01 (-0.01 to -0.01) |
| Morocco | 413215.22 (389908.56-437088.4) | 1353.09 (1282.43-1428.38) | 481006.19 (455834.15-507391.62) | 1351.27 (1280.67-1426.44) | -0.01 (-0.01 to 0) |
| Mozambique | 170001.28 (161295.85-178582.18) | 988.02 (943.45-1034.25) | 401138.86 (380443.97-421685.15) | 987.98 (943.42-1034.28) | 0 (0 to 0) |
| Myanmar | 770833.51 (726960.5-813076.56) | 1647.41 (1559.2-1733.91) | 921006.8 (871170.65-970096.08) | 1647.78 (1560.08-1734.18) | 0 (0 to 0) |
| Namibia | 18593.94 (174 82.06-19812.21) | 1037.84 (979.77-1102.89) | 28058.57 (26427.97-29908.32) | 1038.07 (980.01-1103.14) | 0 (0 to 0) |
| Nauru | 219.79 (207.55-234.26) | 1727.14 (1634.49-1835.33) | 219.37 (207.03-233.68) | 1729.27 (1635.68-1837.67) | 0 (0 to 0.01) |
| Nepal | 375935.39 (352683.91-399637.94) | 1465.56 (1380.32-1552.67) | 474137.65 (445991.11-503166.87) | 1467.36 (1382.01-1554.21) | 0.01 (0 to 0.01) |
| Netherlands | 40 9 975.86 (392628.41-42744 8.76) | 3376.75 (3215.6-3528.6) | 437205.97 (419628.92-455455.69) | 3376.06 (3214.62-3527.7) | 0 (0 to 0) |
| New Zealand | 103271.37 (98916.86-107736.5) | 3354.94 (3202.35-3505.59) | 140997.88 (135642.91-146848.64) | 3379.68 (3240.97-3531.55) | 0.04 (0.03 to 0.05) |
| Nicaragua | 97691.73 (91406.39-103565.68) | 1881.82 (1776.39-1989.34) | 128 467.73 (1209 74.06-1359 05.06) | 1877.97 (1772.31-1985.09) | -0.01 (-0.01 to -0.01) |
| Niger | 113514.82 (107701.24-119259.46) | 1041.75 (995.32-1088.94) | 359687.87 (341112.69-378072.48) | 1041.7 (995.37-1088.83) | 0 (0 to 0) |
| Nigeria | 1180912.83 (1124078.86-1235108.05) | 1052.71 (1006.88-1100.04) | 3081588.23 (2932718.2-3226557.59) | 1054.41 (1008.71-1101.76) | 0.01 (0 to 0.01) |
| Niue | 44.95 (42.4-47.96) | 1725.84 (1632.19-1833.57) | 25.73 (24.37-27.28) | 1726.64 (1633.31-1834.36) | 0 (0 to 0) |
| North | 33870.93 (32053.97-35744.84) | 1801.95 (1702.89-1901.09) | 26003.08 (24783.98-27247.93) | 1797.86 (1698.84-1896.64) | -0.01 (-0.01 to -0.01) |
| MacedoniaNorthern | 765.2 (722.93-813.53) | 1732.5 (1639.91-1839.53) | 737.14 (697.87-781.86) | 1723.36 (1630.9-1831.44) | -0.02 (-0.03 to -0.01) |
| Mariana Islands Norway | 130304.84 (125397.27-135785.77) | 3706.93 (3547.47-3870.42) | 158074.74 (152300.15-163741.14) | 3726.25 (3572.9-3877.65) | 0.03 (0 to 0.05) |
| Oman | 33267.1 (30671.62-35905.25) | 1317.48 (1219.43-1420.79) | 58860.49 (54476.13-63623.02) | 1313.35 (1216.42-1419.24) | -0.04 (-0.06 to -0.02) |
| Pakistan | 2195906.61 (2084977.45-2317441.5) | 1463.58 (1395.7-1536.85) | 4072490.88 (3870797.26-4293005.45) | 1465.06 (1397.24-1538.36) | 0 (0 to 0) |
| Palau | 273.48 (257.94-290.89) | 1725.82 (1632.47-1833.92) | 241.27 (228.83-255.41) | 1713.3 (1620.45-1820.7) | -0.03 (-0.03 to -0.02) |
| Palestine | 40020.96 (36 805.51-43317.74) | 1425.32 (1313.02-1534.83) | 84093.74 (77325.3-90982.74) | 1402.7 (1298.03-1509.92) | -0.03 (-0.04 to -0.01) |
| Panama | 50394.85 (47463.44-53374.66) | 1876.74 (1771.53-1983.98) | 78329.57 (73913.9-82869.96) | 1875.91 (1770.57-1983.03) | 0 (0 to 0) |
| Papua New | 88244.02 (83229.9-94146.44) | 1724.75 (1631.95-1832.88) | 210844.3 (199279.37-224681.08) | 1724.46 (1631.6-1832.48) | 0 (0 to 0) |
| GuineaParaguay | 116328.47 (110688.84-121925.66) | 2413.71 (2309.56-2519.19) | 171383.43 (163780.8-179101.67) | 2411.58 (2307.74-2516.95) | 0 (0 to 0) |
| Peru | 419748.05 (400027.25-441065.27) | 1675.55 (1602.8-1754.59) | 584523.76 (559819.1-611540.12) | 1671.32 (1599.22-1750.4) | 0.01 (-0.02 to 0.03) |
| Philippines | 1265403.2 (1205375.25-1328727.09) | 1652.34 (1583.11-1730.13) | 1936288.86 (1851788.43-2030930.62) | 1647.65 (1578.72-1724.88) | -0.01 (-0.01 to -0.01) |
| Poland | 630317.02 (604115.4-661310.5) | 1824.4 (1747.21-1914.03) | 464865.69 (447787.56-484537.47) | 1821.52 (1744.32-1910.88) | -0.01 (-0.01 to -0.01) |
| Portugal | 291650.54 (279183.68-304866.74) | 3381.49 (3220.39-3533.78) | 251769.22 (241740.85-262061.61) | 3380.8 (3219.58-3532.88) | 0 (0 to 0) |
| Puerto Rico | 68969.93 (65178.02-72655.27) | 1947.08 (1841.88-2048.64) | 47851.37 (45429.63-50366.45) | 1946.08 (1841.11-2047.6) | 0 (0 to 0) |
| Qatar | 5915.04 (5589.03-6249.4) | 1334.96 (1264.35-1410.04) | 30160.06 (28480.06-31824.71) | 1336.26 (1265.63-1411.29) | -0.01 (-0.02 to -0.01) |
| Republic of Korea | 1722320.1 (1624671.69-1825281.66) | 4060.92 (3837.26-4297.59) | 1389962.48 (1317216.61-1468599.17) | 4061.06 (3835.24-4290.6) | 0.02 (0.01 to 0.04) |
| Republic of Moldova | 85102.59 (81808.68-88503.66) | 1944.98 (1868.77-2022.76) | 46127.25 (44563.83-47767.01) | 1934.42 (1858.5-2011.69) | -0.02 (-0.02 to -0.02) |
| Romania | 245668.77 (232340.02-258388.18) | 1202.21 (1133.82-1266.57) | 155583.52 (147703.89-163655.1) | 1218.73 (1151.6-1286.7) | 0.06 (0.05 to 0.08) |
| Russian Federation | 4346437.76 (4210058.72-4512241.61) | 3289.36 (3180.08-3416.85) | 3615594.94 (3510758.94-3728225.58) | 3385.44 (3277.12-3504.09) | 0.14 (0.1 to 0.18) |
| Rwanda | 66723.32 (62112.6-71443.25) | 687.97 (646.9-734.25) | 107376.69 (100464.61-114934.75) | 687.58 (646.68-733.76) | -0.03 (-0.07 to 0.01) |
| Saint Kitts and Nevis | 890.72 (839.49-940.59) | 1947.8 (1842.86-2049.5) | 911.81 (863.09-958.72) | 1946.4 (1841.59-2047.81) | 0 (0 to 0) |
| Saint Lucia | 3096.89 (2917.34-3275.29) | 1949.86 (1844.74-2051.72) | 2751.78 (2607.54-2893.64) | 1943.58 (1838.83-2044.85) | -0.01 (-0.01 to -0.01) |
| Saint Vincent and the Grenadines | 2473.24 (2325.85-2617.55) | 1946.52 (1841.78-2048.15) | 1965.52 (1861.08-2068.01) | 1943.22 (1838.35-2044.39) | -0.01 (-0.01 to -0.01) |
| Samoa | 3678.35 (3459.72-3931.21) | 1721.44 (1628.55-1829.38) | 4307.71 (4066.89-4592.42) | 1726.91 (1633.82-1835.27) | 0.01 (0.01 to 0.01) |
| San Marino | 635.47 (608.58-663.16) | 3380.9 (3219.69-3532.98) | 784.63 (753.79-816.97) | 3376.04 (3215.22-3528.18) | -0.01 (-0.01 to -0.01) |
| Sao Tome and Principe | 1644.61 (1561.24-1727.48) | 1042.03 (995.73-1089.29) | 2548.52 (2428.07-2670.14) | 1041.03 (994.76-1088.14) | 0 (0 to 0) |
| Saudi Arabia | 270500.37 (255001.8-286282.18) | 1344.48 (1273.47-1419.67) | 426677.2 (405030.07-449125.2) | 1341.92 (1271.04-1417.13) | -0.01 (-0.01 to -0.01) |
| Senegal | 105378.54 (100011.34-110694.09) | 1043.34 (996.87-1090.66) | 198107.43 (188488.02-207713) | 1040.08 (994.06-1087.25) | -0.01 (-0.01 to -0.01) |
| Serbia | 146912.61 (139300.99-154490.62) | 1812.9 (1712.22-1913.13) | 104712.67 (99874.8-109725.87) | 1794.61 (1695.5-1892.65) | -0.04 (-0.04 to -0.04) |
| Seychelles | 1306.66 (1233.53-1377.43) | 1640.95 (1553.74-1727.15) | 1492.36 (1418.26-1565.97) | 1625.86 (1540.01-1710.72) | -0.04 (-0.05 to -0.04) |
| Sierra Leone | 54 051.74 (51378.38-566 40.85) | 1042.06 (995.7-1089.27) | 111683.58 (106244.32-117040.15) | 1041.7 (995.34-1088.95) | 0 (-0.01 to 0) |
| Singapore | 85113.64 (78593.88-92312.48) | 3282.37 (3030.97-3527.82) | 128782.05 (120047.69-137752.24) | 3253.32 (3009.67-3499.02) | -0.04 (-0.05 to -0.03) |
| Slovakia | 86099.42 (81551.27-90799.28) | 1805.92 (1706.77-1905.53) | 66285.77 (63123.51-69453.28) | 1801.94 (1702.9-1901.19) | -0.01 (-0.01 to -0.01) |
| Slovenia | 28731.39 (27281.31-30181.58) | 1804.69 (1705.62-1904.07) | 24489.7 (23338.58-25630.91) | 1798.57 (1699.54-1897.47) | -0.01 (-0.01 to -0.01) |
| Solomon Islands | 7769.92 (7318.54-8298.54) | 1725.94 (1633.35-1834.01) | 13965.98 (13180.31-14886.94) | 1727.94 (1634.82-1836.09) | 0.01 (0.01 to 0.01) |
| Somalia | 103495.48 (98072.34-108746.38) | 981.63 (938.07-1027.47) | 282699.79 (268051.69-297024.33) | 984.19 (940.39-1030.19) | 0.01 (0.01 to 0.01) |
| South Africa | 451590.92 (430559.98-473497.24) | 1042.6 (997.44-1089.55) | 572263.82 (547922.59-597813.08) | 1041.09 (996.08-1087.55) | -0.01 (-0.01 to -0.01) |
| South Sudan | 73483.63 (69770.76-77157.68) | 980.58 (936.64-1026.67) | 120531.26 (114266.8-126818.58) | 983.92 (939.87-1029.81) | 0.01 (0.01 to 0.01) |
| Spain | 1030015.36 (945119.77-1133434.71) | 3182.02 (2908.75-3476.47) | 1029814.99 (953156.86-1117361.73) | 3180.95 (2907.72-3475.46) | 0 (0 to 0) |
| Sri Lanka | 309702.37 (290620.6-329004.99) | 1668.59 (1569.06-1768.24) | 329299.81 (311120.11-348845.6) | 1653.8 (1557.94-1751.12) | -0.05 (-0.06 to -0.03) |
| Sudan | 352420.92 (332193.86-372810.97) | 1350.74 (1279.89-1426.05) | 705431.97 (665040.33-746596.45) | 1350.08 (1279.31-1425.33) | 0 (0 to 0) |
| Suriname | 8251.37 (7777.87-8713.51) | 1946.07 (1841.15-2047.68) | 10484.74 (9922.68-11029.07) | 1944.65 (1839.58-2045.96) | 0 (0 to 0) |
| Sweden | 233797.96 (224553.1-243149.76) | 3393.68 (3242.3-3551.41) | 278139.36 (267245.58-288876.06) | 3390.25 (3238.75-3547.55) | 0 (0 to 0) |
| Switzerland | 181657.04 (174042.41-189174.63) | 3374.84 (3213.73-3526.54) | 222529.91 (213470.72-231524.72) | 3372.74 (3211.38-3524.22) | 0 (0 to 0) |
| Syrian ArabRepublic | 233607.45 (220086.56-247204) | 1350.54 (1279.91-1425.74) | 181287.04 (171613.71-191857.28) | 1355.96 (1284.37-1431.04) | 0.01 (0.01 to 0.02) |
| Taiwan (Province of China) | 466523.13 (434079.86-499077.48) | 2322.88 (2165.85-2477.47) | 411288.61 (385402.38-438395.12) | 2369.65 (2202.89-2534.99) | 0.18 (0.12 to 0.23) |
| Tajikistan | 315503.33 (296788.78-334036.64) | 4395.93 (4154.86-4637.51) | 511629.85 (482246.28-540784.5) | 4381.31 (4141.44-4622.99) | -0.01 (-0.01 to -0.01) |
| Thailand | 974763.66 (920786.83-1028206.9) | 1643.16 (1555.73-1729.14) | 801708.01 (762870.35-841118.14) | 1643.94 (1556.8-1730.01) | 0 (0 to 0) |
| Timor-Leste | 15922.01 (15007.48-16791.86) | 1630.1 (1544.77-1715.12) | 26883.62 (25356.6-28347.04) | 1639.63 (1552.78-1725.48) | 0.02 (0.02 to 0.02) |
| Togo | 49271.96 (45616.58-52987.52) | 1005.73 (938.3-1080.29) | 100591.48 (93413.11-108058.71) | 1004.89 (937.6-1079.36) | -0.02 (-0.02 to -0.01) |
| Tokelau | 32.72 (30.83-34.96) | 1729.28 (1635.62-1837.26) | 23.54 (22.19-25.05) | 1725.23 (1632.01-1833.28) | -0.01 (-0.02 to -0.01) |
| Tonga | 2158.3 (2032.83-2305.05) | 1729.85 (1636.39-1837.98) | 2125.9 (2007.87-2265.12) | 1731.28 (1637.93-1839.42) | 0.01 (0 to 0.01) |
| Trinidad and | 25757.09 (24293.29-27198.29) | 1945.93 (1841-2047.38) | 22786.42 (21592.97-23974.5) | 1944.18 (1839.39-2045.46) | 0 (0 to 0) |
| TobagoTunisia | 133358.42 (125798.26-141060.27) | 1351.23 (1280.62-1426.46) | 142254.53 (135064.28-149700.33) | 1350.47 (1279.8-1425.63) | 0 (0 to 0) |
| Turkmenistan | 207730.36 (195393.65-219786.05) | 4401.52 (4160.72-4643.64) | 230542.94 (217825.65-243429.06) | 4370.87 (4131.12-4612.49) | -0.02 (-0.02 to -0.02) |
| Tuvalu | 188.56 (178.58-200.6) | 1735.36 (1641.93-1843.63) | 220.75 (208.67-234.75) | 1721.96 (1629.11-1830.02) | -0.03 (-0.03 to -0.02) |
| Türkiye | 1417271.43 (1330667.5-1516130.66) | 2152.35 (2024.09-2297.34) | 1596344.58 (1492722.31-1702581.05) | 2161.66 (2016.31-2302.64) | 0 (-0.02 to 0.01) |
| Uganda | 288915.71 (266847.74-310952.21) | 1288.84 (1200.13-1383.4) | 715502.91 (659310.09-771374.55) | 1288.47 (1199.69-1382.37) | -0.01 (-0.03 to 0) |
| Ukraine | 873361.94 (840659.57-906538.48) | 1973.01 (1897.56-2053.4) | 556187.85 (537257.59-576047.88) | 1965.29 (1890.17-2045.57) | -0.01 (-0.01 to -0.01) |
| United ArabEmirates | 26865.61 (25394.1-28442.09) | 1337.36 (1266.54-1412.65) | 88052.62 (83355.82-93058.3) | 1338.05 (1266.56-1413.36) | 0 (-0.01 to 0) |
| United Kingdom | 1835372.18 (1767695.62-1909285.89) | 3877.12 (3711.26-4039.82) | 2034646.91 (1960024.92-2109455.64) | 3807.4 (3651.09-3961.73) | -0.09 (-0.13 to -0.04) |
| United Republic of Tanzania | 478169.38 (452987.59-502569.81) | 1440.45 (1375.06-1504.7) | 1024342.4 (973291.12-1079548.96) | 1427.07 (1360.42-1496.89) | -0.07 (-0.1 to -0.04) |
| United States | 2098.75 (1984.47-2213.68) | 1948.91 (1843.55-2050.54) | 1295.6 (1230.03-1363.51) | 1943.39 (1838.55-2044.62) | -0.01 (-0.01 to -0.01) |
| Virgin Islands United States of America | 7453514.16 (7220727.8-7687819.55) | 3169.6 (3064.98-3277.88) | 9189104.25 (8911691.89-9489052.28) | 3161.54 (3052.34-3272.83) | -0.04 (-0.06 to -0.01) |
| Uruguay | 95780.57 (90487.02-101269.99) | 3212.51 (3032.93-3395.66) | 91244.64 (86433.06-96268.17) | 3211.17 (3031.86-3394.03) | 0 (0 to 0) |
| Uzbekistan | 1183547.81 (1113487.43-1252368.03) | 4400.42 (4159.32-4642.28) | 1533464.66 (1450580.53-1619045.69) | 4386.45 (4146.27-4628.25) | -0.01 (-0.01 to -0.01) |
| Vanuatu | 3426.96 (3232.73-3655.76) | 1728.03 (1635.35-1836.14) | 6342.68 (5986.71-6760.67) | 1730.09 (1636.88-1838.23) | 0 (0 to 0.01) |
| Venezuela | 517031.12 (483816.14-554258.45) | 2356.45 (2214.48-2517.36) | 578622.03 (542806.76-614961.19) | 2352.6 (2201.32-2503.24) | -0.02 (-0.03 to -0.01) |
| (Bolivarian Republic of) Viet Nam | 1351225.37 (1274274.61-142 5434.15) | 1650.13 (1562.43-1736.61) | 1511422.52 (1434704.9-1587599.44) | 1635.46 (1549.78-1721.01) | -0.03 (-0.03 to -0.03) |
| Yemen | 265945.87 (250510.47-281117.3) | 1350.45 (1279.66-1425.67) | 567854.33 (534675.94-600792.91) | 1351.41 (1280.78-1426.61) | 0 (0 to 0) |
| Zambia | 102880.54 (97554.31-108058.43) | 986.32 (941.82-1032.6) | 240738.66 (228589.21-253091.94) | 986.14 (941.79-1032.5) | 0 (0 to 0) |
| Zimbabwe | 144687.24 (135878.33-154296.29) | 1037.67 (979.65-1102.66) | 199503.59 (187724.64-212795.25) | 1038.55 (980.43-1103.78) | 0 (0 to 0) |
Table S2 Two hundred and four nations/territories trends in AD burden of incidence (1990-2021)..
| Location | Number 1990 | ASR 1990 | Number 2021 | ASR 2021 | EAPC_95%CI |
|---|---|---|---|---|---|
| Afghanistan | 25066.39 (23279.18-26939.83) | 184.51 (172.31-196.78) | 81427.12 (75483.42-87851.39) | 184.16 (171.92-196.48) | -0.01 (-0.01 to 0) |
| Albania | 8711.07 (8089.39-9406.57) | 230.99 (215.45-248.41) | 4300.96 (4048.26-4581.97) | 231.56 (215.94-248.95) | 0 (0 to 0.01) |
| Algeria | 60485.87 (54659.02-66040.69) | 184.35 (168.91-200.06) | 84615.41 (77364.69-91865.49) | 184.23 (168.79-199.93) | -0.02 (-0.03 to -0.01) |
| American Samoa | 146.96 (135.07-159.29) | 236.16 (217.94-254.87) | 106.25 (97.66-114.91) | 236.37 (218.12-255.07) | 0 (0 to 0) |
| Andorra | 153.14 (143.16-163.04) | 394.58 (365.4-423.53) | 202.46 (190.56-214.55) | 395.44 (366.2-424.35) | 0.01 (0.01 to 0.02) |
| Angola | 21722.96 (19964.36-23476.71) | 146.42 (136.01-157.51) | 67982.08 (62509.05-73636) | 146.67 (136.24-157.75) | 0.01 (0.01 to 0.01) |
| Antigua and Barbuda | 159.92 (147.99-172.75) | 263.46 (244.44-283.72) | 185.68 (173.44-198.53) | 263.12 (244.05-283.38) | -0.01 (-0.01 to -0.01) |
| Argentina | 131986.17 (121666.79-142060.66) | 388.08 (357.88-417.64) | 144436.05 (133962.96-154818.12) | 387.82 (357.72-417.34) | 0 (0 to 0) |
| Armenia | 15175.69 (13992.46-16443.75) | 414.65 (382.76-447.58) | 9451.97 (8764.93-10116.17) | 413.28 (381.47-446.01) | -0.01 (-0.02 to -0.01) |
| Australia | 46093.63 (42943.5-49254.14) | 322.98 (298.64-346.59) | 62855.51 (58635.58-67324.04) | 323.06 (298.28-350.95) | 0.01 (0 to 0.02) |
| Austria | 23162.5 (21654.81-24593.5) | 395.54 (366.22-424.45) | 24907.37 (23393.72-26380.44) | 395.23 (365.95-424.18) | 0 (0 to 0) |
| Azerbaijan | 34625.5 (31907.36-37571.36) | 414.72 (382.86-447.66) | 34689.48 (32118.93-37260.66) | 412.26 (380.52-444.88) | -0.02 (-0.03 to -0.02) |
| Bahamas | 677.31 (626.52-733.86) | 263.35 (244.29-283.61) | 796.68 (740.16-856.06) | 263.35 (244.3-283.61) | 0 (0 to 0) |
| Bahrain | 1031.67 (959.23-1106.89) | 183.61 (171.37-196.04) | 2178.22 (2030.89-2325.14) | 183.24 (171.04-195.68) | -0.01 (-0.01 to -0.01) |
| Bangladesh | 326008.01 (300701.33-354835.48) | 205.09 (190.06-221.99) | 316057.23 (292084.89-342629.16) | 205.42 (190.45-222.33) | 0.01 (0.01 to 0.01) |
| Barbados | 591.43 (550.48-636.27) | 263.42 (244.33-283.67) | 575.15 (537.61-613.46) | 263.08 (243.98-283.33) | 0 (0 to 0) |
| Belarus | 16892.11 (15967.8-17896.62) | 182.02 (171.01-193.53) | 12808.27 (12180.18-13439.22) | 181.36 (170.39-192.83) | -0.01 (-0.01 to -0.01) |
| Belgium | 30225.77 (28282.7-32138.55) | 395.47 (366.18-424.39) | 33150.07 (31134.09-35152.85) | 395.55 (366.26-424.5) | 0 (0 to 0) |
| Belize | 638.34 (587.05-692.58) | 262.98 (243.91-283.16) | 1072.31 (994.4-1159.72) | 263.15 (244.11-283.38) | 0 (0 to 0) |
| Benin | 10415.29 (9706.85-11118.88) | 145.61 (137.2-153.77) | 26533.29 (24798.53-28231.68) | 145.62 (137.21-153.8) | 0 (0 to 0) |
| Bermuda | 131.45 (122.68-140.89) | 263.29 (244.2-283.54) | 117.55 (110.68-125.15) | 263.12 (244.04-283.34) | 0 (0 to 0) |
| Bhutan | 1705.34 (1573.22-1857.93) | 205.17 (190.16-222.15) | 1355.65 (1256.03-1463.88) | 205.32 (190.3-222.33) | 0 (0 to 0) |
| Bolivia (PlurinationalState of) | 18273.19 (17183.53-19491.56) | 227.39 (214.69-240.54) | 26906.86 (25370.73-28545.23) | 227.24 (214.55-240.36) | 0 (0 to 0) |
| Bosnia and Herzegovina | 8997.8 (84 07.92-9674.08) | 232.27 (216.59-249.8) | 4994.05 (4707.8-5308.38) | 232.03 (216.38-249.53) | -0.01 (-0.01 to 0) |
| Botswana | 2697.24 (2473.32-2945.78) | 151.77 (140.16-164.81) | 3602.71 (3324.89-3907.78) | 151.54 (139.94-164.54) | 0 (-0.01 to 0) |
| Brazil | 477938.97 (451199.37-503836.19) | 300.96 (286.2-315.76) | 576541.37 (550985.23-603056.4) | 301.19 (286.17-316.19) | 0 (-0.01 to 0) |
| Brunei Darussalam | 1288.59 (1187.25-1386.33) | 421.88 (390.9-451.27) | 1533.6 (1426.15-1641.63) | 421.93 (390.99-451.23) | 0 (0 to 0) |
| Bulgaria | 15309.52 (14357.19-16360.09) | 232.36 (216.68-249.87) | 10129.62 (9551.73-10750.03) | 231.96 (216.3-249.48) | -0.01 (-0.01 to -0.01) |
| Burkina Faso | 20093.67 (18731.22-21421.23) | 145.74 (137.31-153.93) | 45553.09 (42531.03-48474.58) | 145.74 (137.31-153.93) | 0 (0 to 0) |
| Burundi | 11375.75 (10551.14-12130.88) | 143.6 (133.98-152.17) | 25069.33 (23216.75-26776.45) | 143.31 (133.71-151.88) | -0.01 (-0.01 to -0.01) |
| Cabo Verde | 687.55 (642.68-731.21) | 145.99 (137.55-154.18) | 737.22 (695.78-778.43) | 145.5 (137.07-153.66) | -0.01 (-0.01 to -0.01) |
| Cambodia | 31507.54 (29186.88-34001.91) | 221.07 (206.38-237.32) | 38096.65 (35504.23-40909.72) | 219.88 (205.19-235.86) | -0.02 (-0.02 to -0.01) |
| Cameroon | 24120.45 (22602.32-25821.41) | 162.8 (153.38-173.2) | 65445.66 (61439.93-69813.46) | 162.67 (153.19-172.36) | 0.01 (0 to 0.02) |
| Canada | 75316.9 (71379.91-79412.47) | 316.39 (299.47-334.44) | 95750.12 (90789.32-100573.44) | 316.37 (299.46-334.49) | 0 (0 to 0) |
| Central AfricanRepublic | 5684.44 (5227.97-6139.26) | 146.55 (136.14-157.62) | 10408.19 (9582.41-11257.89) | 146.53 (136.12-157.58) | 0 (0 to 0) |
| Chad | 12888.22 (12022.83-13743.97) | 145.74 (137.3-153.94) | 38431.42 (35809.97-41010.94) | 145.46 (137.05-153.67) | -0.01 (-0.01 to -0.01) |
| Chile | 53453.46 (49368.29-57682.76) | 387.93 (357.81-417.46) | 55903.19 (51983.92-59745.11) | 387.73 (357.64-417.26) | 0 (0 to 0) |
| China | 2260726.63(2146606.12-2376941.26) | 197.94 (187.94-208.35) | 2168642.71 (2075902.3-2264022.66) | 196.63 (187.2-206.73) | 0 (-0.03 to 0.03) |
| Colombia | 96327.21 (89141.86-103996.21) | 258.47 (240.02-278.2) | 106153.68 (99101.15-113792.43) | 258.38 (239.97-278.07) | 0 (0 to 0) |
| Comoros | 909.21 (842.88-970.33) | 143.36 (133.78-151.93) | 1126.37 (1047.68-1198.05) | 143.3 (133.71-151.83) | 0 (0 to 0) |
| Congo | 4046.37 (3675.09-4403.49) | 123.95 (113.75-134.05) | 7527.25 (6867.01-8197.28) | 123.77 (113.57-133.86) | -0.02 (-0.03 to -0.01) |
| Cook Islands | 49.93 (45.89-54.12) | 235.98 (217.76-254.67) | 33.95 (31.56-36.31) | 236.94 (218.58-255.6) | 0.02 (0.01 to 0.02) |
| Costa Rica | 9257.69 (8555.48-10005.48) | 258.29 (239.87-277.98) | 10079.45 (9398.31-10817.25) | 258.55 (240.09-278.25) | 0 (0 to 0) |
| Croatia | 8592.73 (8051.35-9208.34) | 232.28 (216.63-249.81) | 6196.25 (5844.23-6572.53) | 232.06 (216.4-249.57) | 0 (-0.01 to 0) |
| Cuba | 25582.87 (23851.12-27491.85) | 262.8 (243.69-283.01) | 22064.38 (20664.09-23524.36) | 262.74 (243.58-2 82.94) | 0 (0 to 0) |
| Cyprus | 2625.11 (2406.99-2831.77) | 375.77 (343.02-406.3) | 3729.8 (3454.98-4000.5) | 375.77 (343.03-406.32) | -0.01 (-0.01 to 0) |
| Czechia | 18344.16 (17167.99-19625.8) | 232.44 (216.75-249.96) | 17144.52 (16152.37-18233.74) | 232.05 (216.36-249.58) | -0.01 (-0.01 to -0.01) |
| Côte d’Ivoire | 24988 (23324.78-26637.71) | 145.27 (136.88-153.43) | 51440.21 (48149.52-54680.18) | 145.2 (136.81-153.38) | 0 (0 to 0) |
| Democratic People’s Republic of Korea | 50336.19 (47138.62-53663.18) | 235.09 (220.49-250.67) | 48075.23 (45186.71-51107.24) | 234.28 (219.67-249.79) | -0.01 (-0.01 to -0.01) |
| Democratic Republic of the Congo | 81625.62 (749 97.19-88240.28) | 146.53 (136.11-157.64) | 171435.62 (157798.97-185604.63) | 146.4 (136.01-157.46) | 0 (0 to 0) |
| Denmark | 17327.83 (15991.61-18606.75) | 452.33 (413.23-487.03) | 19588.62 (18159.73-20987.28) | 452.19 (413.12-486.9) | 0.02 (0.01 to 0.03) |
| Djibouti | 750.28 (694.8-799.32) | 142.84 (133.31-151.33) | 1937.07 (1804.72-2057.5) | 142.61 (133.09-151.1) | -0.01 (-0.01 to 0) |
| Dominica | 208.84 (192.95-225.45) | 263.03 (243.86-283.28) | 136.73 (127.22-147.02) | 262.95 (243.86-283.12) | 0 (0 to 0) |
| Dominican Republic | 22245.8 (20532.5-24072.87) | 263.3 (244.3-283.53) | 27802.46 (25812.53-29894.68) | 262.97 (243.86-283.18) | 0 (-0.01 to 0) |
| Ecuador | 265 74.39 (24948.49-28555.73) | 229.42 (216.49-244.22) | 40120.23 (37878.53-42766.7) | 229.38 (216.45-244.19) | 0 (0 to 0.01) |
| Egypt | 94451.03 (86758.68-102168.52) | 130.68 (120.88-140.44) | 156081.37 (143073.28-168191.02) | 128.84 (118.69-138.11) | -0.09 (-0.12 to -0.06) |
| El Salvador | 16954.52 (15659.01-18365.96) | 258.61 (240.13-278.32) | 16209.29 (15072.09-17456.99) | 258.56 (240.08-278.15) | 0 (0 to 0) |
| Equatorial Guinea | 911.08 (838.08-985.37) | 146.52 (136.14-157.56) | 2590.65 (2382.43-2803.25) | 145.81 (135.43-156.89) | -0.02 (-0.02 to -0.02) |
| Eritrea | 6792.75 (6298.32-7250.57) | 143.35 (133.78-151.88) | 11307.94 (10488.83-12033.73) | 143.27 (133.68-151.76) | 0 (0 to 0) |
| Estonia | 3254.97 (3053.51-3440.01) | 229.15 (212.96-243.46) | 2408.67 (2282.17-2537.38) | 227.75 (211.63-242.01) | -0.02 (-0.03 to -0.02) |
| Eswatini | 1760.48 (1615.18-1923.93) | 151.84 (140.23-164.87) | 1981.26 (1820.45-2160.54) | 151.53 (139.93-164.54) | -0.01 (-0.01 to -0.01) |
| Ethiopia | 97947.74 (92430.62-104001.18) | 135.64 (128.94-142.75) | 183476.04 (173495.75-194649.81) | 135.63 (128.95-142.73) | 0.06 (0.04 to 0.07) |
| Fiji | 2071.84 (1902-2249.53) | 236.46 (218.22-255.14) | 2184.38 (2012.01-2358.62) | 236.49 (218.25-255.18) | 0 (0 to 0) |
| Finland | 15528.13 (14547.56-16504.99) | 395.64 (366.32-424.52) | 15185.33 (14299.2-16102.11) | 395.46 (366.19-424.38) | 0 (0 to 0) |
| France | 223481.83 (207528.91-240616.73) | 474.02 (436.86-515.1) | 235809.11 (220132.22-251940.27) | 474.06 (436.9-515.16) | -0.02 (-0.03 to -0.01) |
| Gabon | 2351.58 (2140.28-2570.3) | 181.66 (166.68-196.82) | 3697.13 (3359.37-4002.27) | 181.16 (165.88-195.62) | -0.03 (-0.05 to 0) |
| Gambia | 2008.14 (1873.52-2139.53) | 145.45 (137.03-153.67) | 4344.12 (4070.65-4614.56) | 145.58 (137.17-153.78) | 0 (0 to 0) |
| Georgia | 20580.54 (18932.78-22203.6) | 411.89 (377.59-444.71) | 11919.08 (11000.87-12782.68) | 412.64 (379.39-443.88) | 0.02 (0.01 to 0.04) |
| Germany | 238227.52 (224211.48-252475.9) | 402.12 (376.27-429.35) | 239716.76 (226161.11-252860.51) | 400.88 (373.93-427.86) | -0.02 (-0.06 to 0.01) |
| Ghana | 25851.59 (24438.35-27598.16) | 127.57 (121.21-134.71) | 51433.31 (48730.07-54623.64) | 127.69 (121.31-134.86) | 0.06 (-0.04 to 0.16) |
| Greece | 28456.19 (26232.71-30594.47) | 368.91 (338.16-400.69) | 24966.77 (23313.82-26646.85) | 371.25 (340.45-402.38) | 0.03 (0.03 to 0.04) |
| Greenland | 171.45 (161.94-181.6) | 315.27 (298.46-333.39) | 156.97 (148.73-165.55) | 315.73 (298.9-334.11) | 0 (0 to 0) |
| Grenada | 274.6 (253.24-297.36) | 263.37 (244.27-283.61) | 224.58 (209.32-240.76) | 262.79 (243.65-282.95) | -0.01 (-0.01 to -0.01) |
| Guam | 344.87 (317.72-372.5) | 235.9 (217.77-254.6) | 330.68 (306.36-354.56) | 236.23 (218.02-254.92) | 0 (0 to 0) |
| Guatemala | 31179.56 (28680.13-33864.58) | 258.61 (240.14-278.38) | 41359.15 (38300.12-44741.32) | 258.7 (240.24-278.45) | 0 (0 to 0) |
| Guinea | 12333.8 (11513.93-13141.47) | 145.61 (137.18-153.8) | 26012.72 (24323.76-27671.9) | 145.62 (137.2-153.82) | 0 (0 to 0) |
| Guinea-Bissau | 2061.89 (1923.51-2195.84) | 145.79 (137.35-153.98) | 3907.25 (3656.8-4155.64) | 145.69 (137.28-153.88) | 0 (0 to 0) |
| Guyana | 2449.76 (2263.16-2646.87) | 263.24 (244.19-283.46) | 1978.37 (1831.94-2128.71) | 263.1 (244.03-283.34) | 0 (0 to 0) |
| Haiti | 22012.39 (20328.45-23842) | 263.56 (244.6-283.81) | 37256.64 (34460.74-40238.68) | 263.29 (244.26-283.57) | 0 (0 to 0) |
| Honduras | 17023.4 (15679.66-18496.35) | 258.44 (239.99-278.15) | 27437.62 (25435.76-29642.67) | 258.56 (240.1-278.25) | 0 (0 to 0) |
| Hungary | 23129.2 (21405.17-25090.67) | 297.05 (272.78-325.61) | 18975.46 (17685.58-20406.03) | 296.46 (272.22-324.96) | -0.04 (-0.06 to -0.02) |
| Iceland | 974.27 (898.7-1048.9) | 424.9 (390.78-458.54) | 1166.68 (1082.86-1250.59) | 423.32 (389.46-459.33) | -0.02 (-0.03 to -0.02) |
| India | 2195219.28(2063928.56-2345408.51) | 207.51 (196.05-220.9) | 2580420.9 (2438451.18-2744920.69) | 207.53 (196.07-220.95) | -0.02 (-0.04 to -0.01) |
| Indonesia | 463308.15 (436077.19-491414.43) | 220.99 (208.91-233.08) | 551028.01 (523084.42-580319.59) | 222.89 (210.9-235.3) | 0.04 (0.03 to 0.05) |
| Iran (Islamic Republic of) | 156056.95 (146043.35-166775.58) | 202.42 (191.18-214) | 150043.38 (141348.48-158662) | 204.18 (192.55-216.84) | 0.05 (0.04 to 0.06) |
| Iraq | 47275.7 (43824.76-50988.93) | 184.11 (171.88-196.43) | 79672.51 (74004.78-85526.89) | 184.06 (171.83-196.39) | 0 (0 to 0) |
| Ireland | 12932.54 (12002.08-13897.46) | 395.43 (366.13-424.4) | 15338.33 (14351.86-16329.6) | 395.59 (366.27-424.57) | 0 (0 to 0) |
| Israel | 20227.79 (18680.97-21724.54) | 395.62 (366.28-424.62) | 37141.04 (34409.1-39788.91) | 395.49 (366.2-424.45) | 0 (0 to 0) |
| Italy | 181778.19 (172284.83-191021.33) | 453.55 (427.93-480.67) | 176007.01 (167571.48-184244.7) | 453.41 (427.77-480.54) | -0.01 (-0.01 to 0) |
| Jamaica | 6857.35 (6324.48-7430.35) | 263.32 (244.28-283.57) | 5932.53 (5518.39-6367.8) | 263.08 (244.02-283.31) | 0 (0 to 0) |
| Japan | 450799.65 (428843.3-473321.04) | 494.16 (467.66-521.68) | 397124.02 (381075.79-415858.35) | 494.75 (467.73-525.79) | -0.02 (-0.05 to 0) |
| Jordan | 9195.93 (8295.32-10032.94) | 182.35 (166.55-197.84) | 21657.69 (19799.32-23559.69) | 182.22 (166.36-197.68) | -0.01 (-0.01 to -0.01) |
| Kazakhstan | 74224.04 (68395.93-80447.19) | 415.23 (383.2-448.22) | 79700.84 (73570.9-86088.76) | 414.54 (382.63-447.44) | -0.01 (-0.01 to 0) |
| Kenya | 41348.15 (39110.24-43915.78) | 126.92 (121.15-133.01) | 75776.52 (71353.32-80003.78) | 133.53 (126.59-140.24) | 0.23 (0.2 to 0.26) |
| Kiribati | 228.32 (209.59-247.7) | 236.8 (218.53-255.49) | 318.49 (292.89-345.13) | 236.88 (218.6-255.56) | 0 (0 to 0) |
| Kuwait | 3680.88 (3341.39-4012.25) | 191.85 (174.99-20 8.33) | 6681.66 (6146.1-7202.6) | 191.17 (174.26-207.88) | -0.03 (-0.04 to -0.02) |
| Kyrgyzstan | 23639.61 (21754.47-25686.81) | 415.24 (383.24-448.25) | 31386.16 (28895.48-33988.49) | 414.58 (382.64-447.51) | 0 (0 to 0) |
| Lao People’s | 12423.28 (11513.16-13400.34) | 220.4 (205.71-236.48) | 17161.88 (15987.91-18416.37) | 219.66 (204.99-235.63) | -0.01 (-0.01 to -0.01) |
| Democratic Republic Latvia | 2426.85 (2308.01-2552.46) | 104.71 (98.95-110.79) | 1432.64 (1367.87-1499.08) | 104.03 (98.4-109.82) | -0.02 (-0.02 to -0.01) |
| Lebanon | 6391.33 (5952.27-6849.21) | 184.23 (172.03-196.51) | 8700.54 (8140.98-9281.91) | 184.09 (171.85-196.36) | 0 (0 to 0) |
| Lesotho | 3127.29 (2865.93-3413.63) | 152.02 (140.35-165.11) | 3045.97 (2799.61-3316.25) | 151.73 (140.1-164.77) | -0.01 (-0.01 to 0) |
| Liberia | 5045.89 (4708.54-5376.17) | 145.45 (137.03-153.63) | 9585.89 (8992.72-10176.31) | 145.33 (136.94-153.53) | -0.01 (-0.01 to -0.01) |
| Libya | 10161.71 (9412.06-10940.23) | 184.23 (171.94-196.68) | 10086.91 (9387.28-10781.21) | 184.16 (171.92-196.49) | 0 (-0.01 to 0) |
| Lithuania | 5948.6 (5624.55-6289.05) | 182.02 (171-193.53) | 3687.7 (3513.94-3871.97) | 181.38 (170.4-192.86) | -0.01 (-0.01 to -0.01) |
| Luxembourg | 1146.06 (1072.72-1217.87) | 395.58 (366.26-424.51) | 1821.35 (1709.76-1931.47) | 395.35 (366.06-424.31) | 0 (0 to 0) |
| Madagascar | 23510.38 (21813.85-25076.74) | 143.32 (133.74-151.88) | 50709.18 (46894.5-54047.27) | 143.4 (133.81-151.96) | 0 (0 to 0) |
| Malawi | 19790.57 (18380.69-21091.78) | 143.48 (133.88-152.05) | 34405.37 (31791.69-36657.99) | 143.55 (133.94-152.11) | 0 (0 to 0) |
| Malaysia | 45997.85 (42689.09-49585.39) | 219.51 (204.85-235.49) | 61467.07 (57443.08-65941.34) | 218.95 (204.31-234.83) | -0.01 (-0.01 to -0.01) |
| Maldives | 710.15 (657.33-766.34) | 219.14 (204.46-235.07) | 868.71 (810.08-931) | 216.87 (202.25-232.34) | -0.04 (-0.05 to -0.03) |
| Mali | 19345.19 (17836.57-20890.29) | 155.28 (144.49-166.06) | 53031.97 (49033.6-57032.21) | 154.88 (144.71-165.22) | -0.01 (-0.01 to -0.01) |
| Malta | 1270.97 (1183.99-1358.45) | 395.58 (366.26-424.51) | 1252.99 (1181.29-1327.22) | 395.04 (365.74-424) | 0 (-0.01 to 0) |
| Marshall Islands | 149.79 (136.62-163.96) | 236.42 (218.19-255.14) | 135.21 (124.38-146.22) | 236.39 (218.14-255.08) | 0 (0 to 0) |
| Mauritania | 4093.82 (3822.15-4357.06) | 145.52 (137.13-153.71) | 8032 (7532.65-8532.86) | 145.57 (137.16-153.75) | 0 (0 to 0) |
| Mauritius | 2382.68 (2220.23-2559.28) | 219.86 (205.19-235.83) | 2046.06 (1919.99-2182.84) | 219.84 (205.16-235.82) | 0 (0 to 0) |
| Mexico | 237760.31 (224142.18-252164.57) | 231.2 (219.35-244.5) | 261919.06 (248766.3-277237.94) | 229.25 (217.62-242.62) | -0.05 (-0.06 to -0.04) |
| Micronesia (Federated States of) | 321.32 (293.65-350.44) | 236.32 (218.1-255.03) | 237.09 (218.26-256.41) | 236.38 (218.16-255.08) | 0 (0 to 0) |
| Monaco | 77.55 (73.06-82.02) | 395.07 (365.69-424.06) | 102.43 (96.67-108.37) | 396.04 (366.68-424.93) | 0.01 (0.01 to 0.01) |
| Mongolia | 12176.4 (11183.6-13256.37) | 414.8 (382.8-447.81) | 15430.33 (14211.34-16717.76) | 414.54 (382.61-447.45) | 0 (0 to 0) |
| Montenegro | 1310.92 (1224.57-1411.09) | 232.22 (216.53-249.71) | 1048.38 (986.09-1117.2) | 231.78 (216.15-249.21) | -0.01 (-0.01 to -0.01) |
| Morocco | 57403.73 (53317.34-61664.55) | 184.4 (172.17-196.73) | 63944.65 (59687.61-68434.03) | 184.23 (172.01-196.56) | 0 (0 to 0) |
| Mozambique | 26399.43 (24484.29-28177.29) | 143.59 (134-152.19) | 60246.95 (55684.35-64373.32) | 143.62 (134.01-152.19) | 0 (0 to 0) |
| Myanmar | 101874.57 (94476.09-109710.98) | 220.26 (205.56-236.31) | 119976.01 (111985.23-128622.65) | 220.22 (205.54-236.29) | 0 (0 to 0) |
| Namibia | 2821.63 (2593.09-3076.61) | 151.64 (140.04-164.66) | 4027.94 (3704.56-4386.75) | 151.71 (140.09-164.74) | 0 (0 to 0) |
| Nauru | 31.83 (29.17-34.61) | 236.16 (217.91-254.84) | 30.05 (27.62-32.58) | 236.39 (218.18-255.09) | 0 (0 to 0) |
| Nepal | 56381.52 (52055.18-61319.37) | 205.35 (190.36-222.26) | 64056.71 (59200.7-69405.03) | 205.54 (190.58-222.4) | 0 (0 to 0) |
| Netherlands | 45748.73 (42770.87-48645.41) | 395.57 (366.28-424.47) | 48845.17 (45944.21-51725.44) | 395.5 (366.21-424.45) | 0 (0 to 0) |
| New Zealand | 12414.52 (11735.1-13150.09) | 412.8 (388.77-439.74) | 16456.6 (15590.6-17303.98) | 414.66 (390.18-438.66) | 0.02 (0.02 to 0.03) |
| Nicaragua | 13925.97 (12818.01-15143.8) | 258.64 (240.16-278.37) | 17120.46 (15895.87-18483.29) | 258.37 (239.95-278.03) | 0 (0 to 0) |
| Niger | 17427.42 (16244.7-18601.66) | 145.48 (137.07-153.7) | 54200.03 (50497.36-57828.51) | 145.57 (137.17-153.72) | 0 (0 to 0) |
| Nigeria | 178033.1 (168169.76-188223.29) | 147.76 (140.85-155.18) | 444551.87 (420746.75-470918.91) | 147.98 (140.97-155.41) | 0.01 (0 to 0.01) |
| Niue | 6 (5.51-6.53) | 236.21 (217.99-254.93) | 3.35 (3.1-3.59) | 236.26 (218.02-254.98) | 0 (0 to 0.01) |
| North Macedonia | 4208.67 (3927-4531.52) | 232.08 (216.43-249.57) | 3272.84 (3085.31-3486.67) | 231.6 (215.95-249.08) | -0.01 (-0.01 to -0.01) |
| Northern Mariana Islands | 104.98 (96.9-113.02) | 236.85 (218.51-255.54) | 94.77 (87.84-101.62) | 235.95 (217.75-254.64) | -0.01 (-0.02 to -0.01) |
| Norway | 14372.77 (13680.08-15077.84) | 426.5 (403.14-449.97) | 16917.2 (16104.41-17703.1) | 427.69 (404.22-452.01) | 0.02 (0 to 0.04) |
| Oman | 4888.94 (4459.11-5335.62) | 181.64 (166.45-196.44) | 8038.56 (7397.71-8707.8) | 180.94 (166.44-195.19) | -0.03 (-0.04 to -0.02) |
| Pakistan | 325944.67 (306145.25-348586.81) | 207.25 (195.81-220.68) | 574657.94 (540664.64-613709.36) | 207.4 (195.95-220.85) | 0 (0 to 0) |
| Palau | 35.68 (32.85-38.62) | 236.24 (218.04-254.93) | 31.34 (29.18-33.52) | 235.36 (217.3-253.92) | -0.02 (-0.02 to -0.01) |
| Palestine | 5830.72 (5294.24-6341.33) | 191.39 (175.17-206.58) | 11035.09 (10110-11940.89) | 188.91 (173.86-203.46) | -0.02 (-0.04 to -0.01) |
| Panama | 6845.04 (6332.41-7397.71) | 258.22 (239.83-277.95) | 10413.9 (9684.82-11210.86) | 258.15 (239.77-277.83) | 0 (0 to 0) |
| Papua New Guinea | 126 47.7 (11599.37-13747.89) | 235.95 (217.76-254.64) | 30326.51 (27848.02-32879.95) | 235.87 (217.67-254.54) | 0 (0 to 0) |
| Paraguay | 15289.43 (14148.14-16428.26) | 299.95 (279.41-319.76) | 20489.36 (19068.96-21843.48) | 299.79 (279.28-319.58) | 0 (0 to 0) |
| Peru | 56605.16 (53041.04-60145.32) | 225.17 (212.46-238.01) | 77592.93 (73236.91-82049.29) | 224.82 (212.08-237.72) | 0.01 (-0.01 to 0.03) |
| Philippines | 175653.76 (164998.45-185763.48) | 223.25 (211.26-234.76) | 253948.21 (239867.18-267666.13) | 222.89 (210.92-234.42) | -0.01 (-0.01 to -0.01) |
| Poland | 78035.4 (73793.69-82581.41) | 237.1 (223.56-251.68) | 60498.45 (57719.85-63428.64) | 236.73 (223.18-251.32) | -0.01 (-0.01 to -0.01) |
| Portugal | 30759.3 (28696.36-32813.03) | 395.73 (366.39-424.69) | 27768.9 (26175.81-29372.57) | 395.8 (366.46-424.76) | 0 (0 to 0) |
| Puerto Rico | 8992.27 (8341.46-9692) | 263.17 (244.11-283.44) | 5822.31 (5459.1-6205.72) | 263.11 (244.02-283.37) | 0 (0 to 0) |
| Qatar | 847.01 (789.48-909.2) | 182.72 (170.57-195.16) | 4082.3 (3810.91-4352.62) | 182.86 (170.69-195.32) | -0.01 (-0.01 to 0) |
| Republic of Korea | 165453.78 (152963.38-179059.24) | 434.92 (402.59-468.11) | 134273.07 (125819.66-143008.68) | 435.35 (403.91-468.57) | 0.02 (0 to 0.04) |
| Republic of Moldova | 7996.12 (7528.5-8501.92) | 182.27 (171.22-193.77) | 4639.39 (4411.81-4867.67) | 181.16 (170.18-192.62) | -0.02 (-0.02 to -0.02) |
| Romania | 33126.09 (31027.78-35286.09) | 165.4 (153.77-177.26) | 21640.45 (20314.06-22977.46) | 168.13 (156.44-180.02) | 0.08 (0.06 to 0.09) |
| Russian Federation | 301888.23 (288207.91-317393.7) | 224.32 (212.94-237.09) | 262288.58 (251570.21-274057.97) | 236.2 (224.27-249.38) | 0.24 (0.18 to 0.29) |
| Rwanda | 11416.97 (10512.94-12347.96) | 110.65 (102.98-118.41) | 17254.21 (15956.94-18566.3) | 110.6 (102.95-118.35) | -0.03 (-0.07 to 0.01) |
| Saint Kitts and Nevis | 118.03 (109-127.88) | 263.32 (244.24-283.58) | 116.25 (108.56-124.19) | 263.17 (244.1-283.38) | 0 (0 to 0) |
| Saint Lucia | 416.44 (383.58-451.47) | 263.49 (244.45-283.73) | 348.28 (325.56-372.06) | 262.93 (243.81-283.14) | -0.01 (-0.01 to -0.01) |
| Saint Vincent and the Grenadines | 320.05 (294.5-348.21) | 263.24 (244.13-283.47) | 248.79 (231.73-267.83) | 262.91 (243.82-283.09) | 0 (0 to 0) |
| Samoa | 513.58 (470.4-558.55) | 235.8 (217.67-254.49) | 606.98 (557.74-65 8.71) | 236.22 (218.01-254.91) | 0.01 (0.01 to 0.01) |
| San Marino | 67.04 (62.74-71.2) | 395.75 (366.42-424.71) | 83.84 (79.06-88.84) | 395.17 (365.79-424.22) | -0.01 (-0.01 to -0.01) |
| Sao Tome andPrincipe | 237.09 (221.84-252.38) | 145.61 (137.2-153.82) | 345.94 (325.02-366.87) | 145.48 (137.08-153.67) | 0 (0 to 0) |
| Saudi Arabia | 37982.05 (35198.12-40938.06) | 183.66 (171.44-196.07) | 55058.2 (51393.23-58943.16) | 183.36 (171.14-195.69) | -0.01 (-0.01 to -0.01) |
| Senegal | 15852.79 (14784.46-16892.12) | 145.71 (137.28-153.92) | 28091.9 (26345.44-29808.07) | 145.43 (137.02-153.6) | -0.01 (-0.01 to -0.01) |
| Serbia | 18342.88 (17151.1-19691) | 234.8 (218.84-252.37) | 12880.99 (12150.89-13690.35) | 231.29 (215.71-248.74) | -0.06 (-0.06 to -0.05) |
| Seychelles | 171.27 (159.1-184.02) | 219.89 (205.21-235.85) | 197.58 (185.41-210.94) | 218.99 (204.34-234.78) | -0.02 (-0.02 to -0.02) |
| Sierra Leone | 8269.45 (7726.44-8803.95) | 145.56 (137.13-153.75) | 16066.54 (15046.26-17067.1) | 145.55 (137.13-153.74) | 0 (0 to 0) |
| Singapore | 9334.61 (8591.22-10101.4) | 391.09 (358.06-422.1) | 15386.48 (14354.33-16474.5) | 389.04 (358.98-420.79) | -0.02 (-0.03 to -0.02) |
| Slovakia | 10603.32 (9901.21-11399.98) | 232.63 (216.94-250.16) | 8674.8 (8171.4-9231.67) | 232.12 (216.45-249.65) | -0.01 (-0.01 to -0.01) |
| Slovenia | 3507.38 (3285.65-3759.12) | 232.37 (216.71-249.93) | 3168.57 (2986.58-3368.06) | 231.7 (216.04-249.22) | -0.01 (-0.01 to -0.01) |
| Solomon Islands | 1126.23 (1030.44-1226.5) | 236.01 (217.78-254.7) | 1960.49 (1800.16-2126.35) | 236.2 (217.98-254.88) | 0 (0 to 0) |
| Somalia | 16323.55 (15143.48-17428.61) | 142.96 (133.42-151.46) | 44217.83 (40988.67-47178.8) | 143.24 (133.66-151.73) | 0.01 (0 to 0.01) |
| South Africa | 66 858.26 (629 74.65-70710.63) | 153.47 (145.05-161.78) | 81658.5 (77176.63-86160.86) | 153.33 (144.93-161.65) | 0 (0 to 0) |
| South Sudan | 11257.04 (10432.71-12006.67) | 142.74 (133.23-151.27) | 18100.72 (16772.26-19291.21) | 143.14 (133.62-151.71) | 0.01 (0.01 to 0.01) |
| Spain | 111082.97 (102448.04-120297.91) | 384.8 (351.63-419.61) | 116001.24 (107586.11-124691.81) | 384.75 (351.57-419.57) | 0 (0 to 0.01) |
| Sri Lanka | 39431.49 (36474.37-42314.37) | 221.38 (205.72-236.75) | 41905.54 (39156.89-44733.15) | 220.59 (205.43-235.9) | -0.02 (-0.02 to -0.01) |
| Sudan | 50981.79 (47291.29-54934.81) | 183.99 (171.75-196.28) | 95127.33 (88155.92-101910.68) | 184.07 (171.86-196.33) | 0 (0 to 0) |
| Suriname | 1092.55 (1009.34-1182.68) | 263.32 (244.25-283.57) | 1358.35 (1263.47-1464.35) | 263.05 (243.95-283.3) | 0 (-0.01 to 0) |
| Sweden | 27473.8 (26210.81-28781.39) | 404.07 (382.93-427.92) | 31708.34 (30288.45-33221.07) | 403.91 (382.77-427.76) | 0 (0 to 0) |
| Switzerland | 20364.03 (19057.98-21622.53) | 395.5 (366.22-424.41) | 25068.61 (23552.4-26550.49) | 395.3 (366.03-424.24) | 0 (0 to 0) |
| Syrian Arab Republic | 32954.71 (30509.61-35576.06) | 184.14 (171.91-196.45) | 22418.67 (20820.87-23913.21) | 184.55 (172.34-196.84) | 0.01 (0 to 0.01) |
| Taiwan (Province ofChina) | 51993.06 (47858.18-56150.66) | 281.25 (260.15-302.51) | 46025.85 (42983.83-49082.42) | 284.82 (263.57-307.04) | 0.13 (0.08 to 0.17) |
| Tajikistan | 32734.07 (30037.7-35716.73) | 414.72 (382.8-447.67) | 50217.96 (46257.33-54542.43) | 413.73 (381.88-446.59) | -0.01 (-0.01 to -0.01) |
| Thailand | 122076.84 (113622.87-131573.99) | 219.87 (205.2-235.89) | 101142.59 (95091.61-107508.94) | 219.76 (205.09-235.79) | 0 (0 to 0) |
| Timor-Leste | 2334.16 (2163.3-2510.35) | 218.72 (204.06-234.55) | 3611.2 (3346.93-3886.93) | 219.28 (204.63-235.26) | 0.01 (0.01 to 0.01) |
| Togo | 7393.09 (6828.12-7982.42) | 142.48 (132.86-152.65) | 14409.63 (13342.71-15510.52) | 142.44 (132.81-152.57) | -0.01 (-0.02 to -0.01) |
| Tokelau | 4.41 (4.04-4.81) | 236.39 (218.11-255.05) | 2.91 (2.67-3.15) | 235.99 (217.8-254.7) | -0.01 (-0.01 to -0.01) |
| Tonga | 304.77 (279.21-331.41) | 236.39 (218.14-255.04) | 300.19 (276.06-325.54) | 236.42 (218.17-255.08) | 0 (0 to 0) |
| Trinidad and Tobago | 3408.44 (3151.01-3694.74) | 263.17 (244.09-283.4) | 2918.85 (2724.45-3129.73) | 262.96 (243.85-283.16) | 0 (0 to 0) |
| Tunisia | 18078.36 (16778.72-19361.87) | 184.2 (171.98-196.51) | 18864.67 (17635.41-20131.65) | 184.11 (171.88-196.39) | 0 (0 to 0) |
| Turkmenistan | 20907.05 (19212.91-22768.26) | 415.11 (383.14-448.12) | 21840.02 (20150.08-23607.16) | 413.27 (381.36-446.1) | -0.01 (-0.01 to -0.01) |
| Tuvalu | 28.57 (26.24-30.91) | 236.61 (218.32-255.24) | 29.86 (27.5-32.24) | 235.81 (217.68-254.52) | -0.01 (-0.01 to -0.01) |
| Türkiye | 160670.48 (147421.23-174159.03) | 247.3 (228.3-267.31) | 170637.76 (157358.99-183905.77) | 248.02 (227.29-268.8) | 0 (-0.01 to 0.01) |
| Uganda | 43047.75 (39513.58-46765.72) | 171.75 (158.69-185.15) | 99659.16 (91285.16-108768.26) | 171.75 (158.73-185.15) | -0.01 (-0.02 to 0) |
| Ukraine | 85992.51 (81626.81-90678.47) | 190.39 (179.55-202.41) | 55733.47 (53447.13-58295.86) | 189.57 (178.77-201.58) | -0.01 (-0.01 to -0.01) |
| United Arab Emirates | 3800.02 (3534.01-4085.49) | 182.89 (170.69-195.35) | 11703.87 (10892.11-12567.76) | 182.74 (170.43-195.22) | 0 (-0.01 to 0) |
| United Kingdom | 200318.2 (190564.04-209913.18) | 435.62 (412.31-458.99) | 216609.69 (206535.08-227886.37) | 430.3 (406.36-455.45) | -0.06 (-0.1 to -0.02) |
| United Republic of Tanzania | 66092.17 (61375.74-70876.64) | 183.85 (172.23-196.01) | 135195.06 (125508.48-146023.64) | 182.87 (170.88-196.04) | -0.05 (-0.07 to -0.03) |
| United States VirginIslands | 283.17 (262.57-305.29) | 263.35 (244.34-283.62) | 167.5 (157.2-178.54) | 262.72 (243.64-282.93) | -0.01 (-0.01 to -0.01) |
| United States of America | 770603.6 (739275.16-803066.36) | 336.56 (321.57-351.78) | 922005.35 (886551.21-959007.75) | 336.57 (321.52-351.42) | -0.02 (-0.04 to 0) |
| Uruguay | 11320.19 (10466.42-12130.48) | 387.94 (357.8-417.48) | 10138.15 (9415.92-10837.17) | 3 87.74 (357.7-417.26) | 0 (0 to 0) |
| Uzbekistan | 120006.27 (110278.4-130719.25) | 415.02 (383.06-448.01) | 151167.03 (139527.09-163702.32) | 413.74 (381.89-446.55) | -0.01 (-0.01 to -0.01) |
| Vanuatu | 505.45 (462.63-549.34) | 236.16 (217.93-254.83) | 884.5 (811.89-960.04) | 236.45 (218.2-255.13) | 0 (0 to 0) |
| Venezuela(Bolivarian Republic of) | 66630.96 (61079.13-72400.9) | 299.82 (277.12-323.9) | 71991.27 (66 867.01-77446.82) | 299.4 (277.48-322.22) | -0.01 (-0.02 to -0.01) |
| Viet Nam | 182501.94 (169211.28-196828.26) | 220.31 (205.62-236.38) | 198084.9 (185491.98-212309.44) | 219.16 (204.53-235.09) | -0.02 (-0.02 to -0.02) |
| Yemen | 39344.12 (36393.5-42539.78) | 184.2 (171.99-196.51) | 77326.88 (71594.98-83042.39) | 184.24 (172.01-196.56) | 0 (0 to 0) |
| Zambia | 16041.85 (14886.37-17103.27) | 143.42 (133.83-152.01) | 35515.83 (32836.09-37878.35) | 143.41 (133.81-151.97) | 0 (0 to 0) |
| Zimbabwe | 21876.17 (20064.32-23885.01) | 151.62 (140.04-164.6) | 29415.36 (26998.59-32149.11) | 151.76 (140.13-164.81) | 0 (0 to 0) |
Table S3 204 nations/territories trends in AD burden of disability-adjusted life years (1990-2021).
| Location | Number 1990 | ASR 1990 | Number 2021 | ASR 2021 | EAPC_95%CI |
|---|---|---|---|---|---|
| Afghanistan | 7493.24 (3847.05-12719.84) | 58.9 (30.23-99.77) | 24861.79 (12739.36-42260.58) | 58.89 (30.36-99.41) | 0.01 (0.01 to 0.01) |
| Albania | 2981.38 (1550.7-5126.56) | 79.15 (41.1-136.42) | 1498.14 (785.32-2568.44) | 79.42 (41.55-136) | 0.01 (0.01 to 0.02) |
| Algeria | 19356.89 (9919.5-31918.26) | 59.14 (30.42-97.3) | 26932.97 (13887.35-44617.32) | 59.29 (30.61-98.23) | -0.01 (-0.03 to 0) |
| American Samoa | 44.47 (22.6-75.76) | 75.77 (38.47-129.34) | 37.39 (19.03-63.57) | 75.7 (38.58-128.73) | 0.01 (0 to 0.01) |
| Andorra | 63.24 (33.15-106.63) | 147.49 (77.37-249.3) | 82.94 (43.24-137.87) | 147.67 (76.82-246.24) | 0.01 (0 to 0.01) |
| Angola | 5852.73 (2960.6-9862.78) | 42.9 (21.81-72.45) | 19289.45 (9924.64-32014.83) | 43.27 (22.35-72.38) | 0.03 (0.02 to 0.03) |
| Antigua and Barbuda | 53.08 (27.73-88.92) | 84.98 (44.36-142.33) | 62.66 (32.44-104.59) | 84.82 (43.84-142.57) | -0.01 (-0.01 to -0.01) |
| Argentina | 48143.64 (24548.57-81418.28) | 140.57 (71.65-237.26) | 56566.95 (28995.84-95443.16) | 140.49 (71.65-236.68) | 0 (-0.01 to 0) |
| Armenia | 6937.62 (3588.69-11594.31) | 192.6 (99.56-321.76) | 4557.94 (2325.65-7563.72) | 192.57 (97.98-320.82) | 0 (-0.01 to 0) |
| Australia | 15177.61 (7822.91-25060.86) | 103.5 (53.2-171.68) | 20660.17 (10761.15-34607.62) | 103.67 (53.97-174.29) | 0.01 (0 to 0.02) |
| Austria | 9092.55 (4795.54-15021.3) | 147.96 (77.45-246.53) | 9578.56 (4952.56-15841.33) | 147.93 (75.72-246.43) | 0 (0 to 0) |
| Azerbaijan | 15835.6 (8107.4-26922.73) | 192.92 (99.06-327.9) | 17216.11 (8809.17-28634.89) | 191.94 (98.16-320.47) | -0.02 (-0.02 to -0.02) |
| Bahamas | 230.89 (121.68-383.72) | 84.98 (44.83-140.81) | 283.88 (147.55-482.54) | 84.99 (43.88-144.89) | 0 (0 to 0) |
| Bahrain | 325.2 (168.41-558.53) | 59.03 (30.51-101.44) | 744.91 (386.01-1282.94) | 58.97 (30.52-101.22) | -0.01 (-0.01 to 0) |
| Bangladesh | 95940.18 (49121.43-161399.73) | 63.97 (32.87-108.26) | 105109.85 (53081.76-177899.72) | 64.49 (32.61-109.07) | 0.04 (0.03 to 0.04) |
| Barbados | 201.72 (106.02-341.01) | 85.15 (44.64-143.94) | 195.1 (102.42-324.81) | 84.85 (43.97-143.46) | -0.01 (-0.01 to -0.01) |
| Belarus | 7787.9 (3996.89-13090.72) | 85.47 (43.75-143.9) | 5660.58 (2887.72-9621.68) | 85.32 (43.34-145.21) | 0 (0 to 0) |
| Belgium | 11751.73 (6196.17-19403.37) | 147.89 (77.33-245.22) | 12890.09 (6722.08-21430.48) | 147.98 (77.06-245.92) | 0 (0 to 0) |
| Belize | 201.41 (105.64-348.11) | 84.86 (44.67-146.05) | 367.24 (191.88-615.93) | 84.76 (44.21-142.42) | 0.01 (0 to 0.01) |
| Benin | 2990.5 (1531.78-5025.67) | 45.25 (23.49-76.17) | 7918.42 (4020.07-13576.29) | 45.5 (23.01-77.72) | 0.02 (0.01 to 0.02) |
| Bermuda | 43.07 (22.15-72.31) | 85.19 (43.61-144.46) | 38.8 (20.06-65.34) | 84.99 (43.6-142.95) | 0 (-0.01 to 0) |
| Bhutan | 525.49 (271.61-877.02) | 63.81 (33.07-106.78) | 447.84 (229.32-754) | 64.17 (32.86-107.89) | 0.02 (0.02 to 0.03) |
| Bolivia (Plurinational State of) | 5753.73 (2981.74-99 09.6) | 73.87 (38.54-125.97) | 8897.12 (4568.84-15005.19) | 73.97 (38-124.91) | 0.01 (0.01 to 0.02) |
| Bosnia and Herzegovina | 3208.28 (1675.11-5401.15) | 79.5 (41.5-133.89) | 1719.55 (886.2-2924.44) | 79.56 (40.85-135.18) | 0 (0 to 0.01) |
| Botswana | 790.81 (399.26-1367.07) | 45.49 (23.16-78.99) | 1104.52 (558.5-1925.94) | 45.34 (22.91-79.04) | 0 (-0.01 to 0) |
| Brazil | 167600.48 (87433.46-277654.04) | 102.07 (53.29-168.67) | 201107.04 (104842.16-333071.82) | 102.41 (53.31-169.88) | 0.01 (0 to 0.02) |
| Brunei Darussalam | 497.14 (253.18-829.65) | 167.82 (85.9-280) | 646.64 (333.75-1093.37) | 167.94 (86.2-283.33) | 0 (-0.01 to 0) |
| Bulgaria | 5377.56 (2752.12-9333.9) | 79.53 (40.7-138.39) | 3425.13 (1754.39-5829.37) | 79.48 (40.42-134.56) | 0 (0 to 0) |
| Burkina Faso | 5791.62 (2986.03-9882.26) | 45.22 (23.08-76.84) | 13345.51 (6883.36-22791.2) | 45.41 (23.54-77.59) | 0.03 (0.03 to 0.04) |
| Burundi | 3127.65 (1635.23-5167.18) | 42.97 (22.39-71.39) | 7294.44 (37 74.27-12156.89) | 43.15 (22.32-72.3) | 0.02 (0.01 to 0.02) |
| Cabo Verde | 207.04 (105.94-353.84) | 45.71 (23.43-77.85) | 243.4 (124.85-413.4) | 45.65 (23.37-77.59) | -0.01 (-0.01 to 0) |
| Cambodia | 9622.68 (4965.32-16296.42) | 72.21 (37.36-122.53) | 12677.76 (6542.23-21712.34) | 71.8 (37-122.94) | -0.01 (-0.01 to 0) |
| Cameroon | 7389.06 (3796.24-12338.87) | 54.35 (28-90.3) | 21505.76 (10925.45-36089.11) | 54.54 (27.78-91.98) | 0.05 (0.04 to 0.07) |
| Canada | 30764.34 (16136.6-50830.42) | 124.29 (64.95-205.57) | 39387.02 (20191.47-65286.71) | 124.2 (63.7-206.89) | 0 (0 to 0) |
| Central African Republic | 1532.23 (774.53-2607.76) | 42.78 (21.8-73.02) | 2976.71 (1539.51-4948.03) | 42.87 (22.2-71.84) | 0.02 (0.02 to 0.03) |
| Chad | 3637.77 (1877.73-6212.31) | 45.35 (23.2-77.34) | 11132.29 (5744.89-19160.38) | 45.42 (23.34-77.45) | 0 (0 to 0.01) |
| Chile | 19298.26 (9871.1-3245 8.74) | 140.44 (71.91-236.42) | 21689.1 (11282.83-36979) | 140.32 (72.5-239.85) | 0 (0 to 0) |
| China | 702325.6 (364129.71-1178115.94) | 59.85 (31.01-100.45) | 677518.92 (350336.06-1138532.72) | 59.53 (30.92-99.89) | 0.01 (-0.01 to 0.03) |
| Colombia | 30516.83 (15610.63-50295.41) | 82.22 (42.05-135.72) | 35281 (18107.23-58303.49) | 82.32 (42.01-136.26) | 0 (0 to 0.01) |
| Comoros | 259.28 (135.04-443.8) | 43.14 (22.43-73.66) | 345.82 (178.43-571.17) | 43.21 (22.38-71.51) | 0.02 (0.01 to 0.02) |
| Congo | 1092.18 (553.19-1855.64) | 34.48 (17.56-58.67) | 2153.78 (1104.69-3670.5) | 34.52 (17.71-58.95) | -0.01 (-0.02 to 0) |
| Cook Islands | 16.31 (8.34-27) | 75.9 (38.81-126.03) | 11.51 (5.86-19.32) | 76.36 (38.92-127.99) | 0.02 (0.02 to 0.03) |
| Costa Rica | 2914.41 (1485.14-4938.98) | 82.24 (41.92-138.9) | 3389.41 (1753.22-5652.22) | 82.21 (42.39-137.08) | 0 (0 to 0.01) |
| Croatia | 3061.38 (1591.78-5150.06) | 79.76 (41.45-134.16) | 2123.29 (1094.8-3671.75) | 79.69 (41.09-138.06) | 0 (0 to 0) |
| Cuba | 8505.48 (4527.59-14338.18) | 84.79 (45.08-142.82) | 7352.33 (3829.51-12272.5) | 84.75 (44.18-141.9) | 0.01 (0.01 to 0.01) |
| Cyprus | 967.14 (494.14-1594.42) | 133.37 (68.13-220.16) | 1341.97 (689.36-2204.15) | 133.31 (67.98-219.19) | -0.01 (-0.02 to 0) |
| Czechia | 6597.72 (3362.54-11191.09) | 79.62 (40.75-135.23) | 5730.33 (2966.28-9761.95) | 79.61 (40.89-134.84) | 0 (0 to 0) |
| Côte d’Ivoire | 7259.02 (3675.87-12116.42) | 45.11 (22.92-75.69) | 15581.51 (8079.6-26851.15) | 45.46 (23.43-78.17) | 0.02 (0.01 to 0.02) |
| Democratic People’s | 16005.64 (8138.6-27652.69) | 76.92 (39.14-133.09) | 16476.27 (8488.5-27886.84) | 76.71 (39.57-130.38) | -0.01 (-0.01 to -0.01) |
| Republic of Korea | |||||
| Democratic Republic of the Congo | 21830.97 (11134.7-37198.03) | 42.59 (21.76-72.83) | 49629.67 (25136.5-83855.95) | 42.96 (21.96-72.45) | 0.03 (0.02 to 0.04) |
| Denmark | 7688.9 (4038.53-12663.79) | 187.72 (97.69-311.57) | 8508.88 (4498.2-14192.76) | 188.08 (98.83-313.32) | 0.05 (0.03 to 0.07) |
| Djibouti | 221.04 (114.79-371.59) | 42.85 (22.18-72.21) | 584.51 (302.92-973.63) | 43.02 (22.29-71.7) | 0 (0 to 0.01) |
| Dominica | 67.77 (35.04-115.79) | 84.83 (43.77-144.17) | 48.61 (25.04-80.66) | 84.59 (43.84-139.57) | -0.01 (-0.01 to -0.01) |
| Dominican Republic | 7067 (3659.67-11642.09) | 84.96 (44.35-140.53) | 9073.65 (4758.96-15258.06) | 84.91 (44.54-143.07) | 0 (-0.01 to 0) |
| Ecuador | 8780.11 (4530.5-14801.9) | 75.29 (39.12-126.72) | 13562.39 (7005.38-22470.47) | 75.53 (39.02-125) | 0.02 (0.01 to 0.02) |
| Egypt | 25844.06 (13323.67-44663.41) | 37.15 (19.23-64.3) | 44526.35 (23164.7-73642.68) | 36.78 (19.2-61.04) | -0.08 (-0.11 to -0.05) |
| El Salvador | 5317.85 (2729.98-8913.98) | 81.92 (42.03-137.31) | 5310.22 (2725.16-8820.16) | 82.24 (42.22-136.72) | 0.02 (0.01 to 0.02) |
| Equatorial Guinea | 240.78 (123.13-403.5) | 42.5 (21.74-71.02) | 795.23 (411.17-1364.93) | 42.73 (22.05-73.01) | 0.02 (0.01 to 0.02) |
| Eritrea | 1906.61 (962.54-3286.47) | 42.72 (21.64-72.09) | 3353.7 (1720.3-5681.05) | 43.05 (22.19-73.23) | 0.02 (0.02 to 0.03) |
| Estonia | 2447.46 (1262.31-4131.61) | 181.33 (93.56-305.93) | 1681.1 (858.45-2781.8) | 180.86 (91.83-299.3) | -0.03 (-0.04 to -0.01) |
| Eswatini | 505.74 (261.54-855.19) | 45.65 (23.61-77.34) | 604.29 (307.81-1045.44) | 45.38 (23.12-78.48) | -0.02 (-0.03 to -0.02) |
| Ethiopia | 26389.53 (13646.33-44051.45) | 39.11 (20.23-65.06) | 52923.7 (27252.05-89494.39) | 39.41 (20.31-66.59) | 0.1 (0.07 to 0.12) |
| Fiji | 677.11 (352.68-1122.7) | 75.77 (39.52-125.96) | 711.82 (363.89-1192.82) | 75.8 (38.77-127.05) | 0.01 (0 to 0.01) |
| Finland | 6011.92 (3120.63-10081.39) | 147.81 (76.56-248.22) | 6007.25 (3109.95-10097.02) | 147.89 (76.28-248.19) | 0 (0 to 0) |
| France | 102118.72 (52595.44-172307.69) | 205.25 (105.27-346.14) | 108309.01 (55551.35-181507.08) | 205.27 (105.28-345.38) | -0.04 (-0.06 to -0.01) |
| Gabon | 704.06 (368.01-1179.13) | 57.2 (30.09-95.38) | 1198.07 (622.57-2009.07) | 57.47 (29.99-96.53) | -0.01 (-0.04 to 0.02) |
| Gambia | 586.15 (296.69-996.5) | 45.4 (23.16-77.62) | 1341.39 (697.43-2329.58) | 45.52 (23.51-78.96) | 0.01 (0.01 to 0.02) |
| Georgia | 9711.61 (4993.36-16202.29) | 191.08 (98.19-318.58) | 5570.64 (2836.78-9554.36) | 191.72 (96.85-328.19) | 0.03 (0.02 to 0.05) |
| Germany | 92546.82 (47739.84-153785.4) | 151.95 (78.04-253.79) | 92134.83 (47830.76-154516.85) | 151.29 (77.56-252.14) | -0.02 (-0.08 to 0.04) |
| Ghana | 7231.22 (3790.29-12189.99) | 37.44 (19.63-63.41) | 15058.1 (7725.02-25359.18) | 37.65 (19.3-63.52) | 0.09 (-0.02 to 0.2) |
| Greece | 10876.64 (5523.92-17743.61) | 129.37 (66.04-212.59) | 9050.95 (4779.27-14723.66) | 130.25 (67.56-211.99) | 0.04 (0.03 to 0.05) |
| Greenland | 66.42 (34.71-110.77) | 122.73 (64.14-204.45) | 62.37 (32.31-104.52) | 123.14 (63.72-206.07) | 0.02 (0.02 to 0.02) |
| Grenada | 86.76 (44.83-145.14) | 84.74 (43.89-141.02) | 75.75 (39.47-126.21) | 84.47 (43.84-141.34) | -0.01 (-0.02 to -0.01) |
| Guam | 108.57 (55.05-182.95) | 75.71 (38.41-127.9) | 106.49 (55.57-180.81) | 75.87 (39.42-128.8) | 0.01 (0 to 0.01) |
| Guatemala | 9342.57 (4786.74-156 82.32) | 81.74 (41.97-136.34) | 13873.56 (7029.97-23173.56) | 82.19 (41.63-136.91) | 0.02 (0.02 to 0.02) |
| Guinea | 3498.5 (1811.71-6010.77) | 45.37 (23.49-77.06) | 7858.23 (4077.97-13364.59) | 45.52 (23.69-77.8) | 0.01 (0 to 0.01) |
| Guinea-Bissau | 604.39 (312.35-1027.24) | 45.25 (23.5-76.27) | 1188.29 (617.87-2017.66) | 45.54 (23.5-77.36) | 0.02 (0.02 to 0.03) |
| Guyana | 762.39 (396.41-1278.5) | 84.48 (44.16-141.41) | 642.06 (331.38-1069.86) | 84.41 (43.61-140.19) | 0.01 (0 to 0.01) |
| Haiti | 6616.69 (3429.51-11170.93) | 84.04 (43.24-141.83) | 11819.65 (6088.58-20041.76) | 84.08 (43.36-142.33) | 0 (-0.01 to 0) |
| Honduras | 5169.49 (2613.17-8645.17) | 81.93 (41.68-136.03) | 8995.71 (4610.69-15375.09) | 82.1 (42.16-139.84) | 0.01 (0.01 to 0.02) |
| Hungary | 9506.58 (4926.39-16021.81) | 115.41 (59.24-192.85) | 7276.66 (3809.52-12158.67) | 115.28 (59.18-193.44) | -0.05 (-0.08 to -0.02) |
| Iceland | 396.14 (207.13-661.24) | 167 (87.17-278.31) | 473.34 (244.46-779.12) | 165.87 (85.51-274.12) | -0.03 (-0.04 to -0.02) |
| India | 667967.49 (344563.82-1122662.25) | 63.78 (32.92-107.26) | 862682.81 (442421.53-1432992.21) | 64.22 (33-106.61) | 0 (-0.02 to 0.01) |
| Indonesia | 154206.46 (79179.53-258642.32) | 71.72 (36.88-119.94) | 186745.27 (97621.23-311692.64) | 72.45 (37.88-120.99) | 0.05 (0.04 to 0.06) |
| Iran (Islamic Republic of) | 50720.77 (26304.31-84583.47) | 66.47 (34.4-110.91) | 52066.2 (26496.8-87972.22) | 67.53 (34.36-113.83) | 0.08 (0.07 to 0.1) |
| Iraq | 14507.1 (7524.9-24764.7) | 59.08 (30.54-100.34) | 26728.91 (13538.75-44730.42) | 59.18 (30.04-99.36) | 0.01 (0 to 0.01) |
| Ireland | 5193.84 (2682.44-8807.88) | 147.79 (76.21-250.02) | 6026.98 (3171.41-10098.06) | 147.8 (77.07-248.32) | 0 (0 to 0.01) |
| Israel | 7688.59 (3995.38-12658.37) | 148.18 (77-243.7) | 13850.66 (7234.31-23054.55) | 148.17 (77.35-246.83) | 0 (0 to 0) |
| Italy | 80140.57 (41831.54-133954.89) | 181.25 (94.05-304.27) | 75460.2 (38851.2-126154.32) | 181.1 (94.01-305.36) | -0.01 (-0.02 to 0) |
| Jamaica | 2265.88 (1168.77-3906.31) | 85.04 (43.97-145.76) | 2061.87 (1065.94-3494.14) | 84.77 (43.97-144.2) | 0 (-0.01 to 0) |
| Japan | 2160 47.15 (110383.74-359290.06) | 214.48 (109.22-357.97) | 181382.18 (93536.14-300726.4) | 215.1 (109.77-358.88) | -0.02 (-0.06 to 0.02) |
| Jordan | 2884.57 (1477-4746.09) | 58.29 (29.92-95.9) | 7411.31 (3876.81-12200.01) | 58.3 (30.54-96.17) | 0 (-0.01 to 0) |
| Kazakhstan | 33927.55 (17433.12-56664.77) | 192.55 (99.21-321.58) | 36100.69 (18603.78-60594.9) | 193.06 (99.32-324.16) | 0.01 (0.01 to 0.02) |
| Kenya | 11338.05 (5885.1-19239.26) | 36.5 (18.86-61.79) | 22787.2 (11718.57-38102.4) | 38.64 (19.91-64.59) | 0.27 (0.23 to 0.3) |
| Kiribati | 68.69 (35.36-114.94) | 75.57 (38.92-126.94) | 102.99 (52.17-171.07) | 75.78 (38.52-126.01) | 0.01 (0.01 to 0.02) |
| Kuwait | 1193.58 (616.93-1960.3) | 63.07 (32.61-103.64) | 2314.26 (1181.07-3819.71) | 62.72 (31.81-104.89) | -0.05 (-0.06 to -0.03) |
| Kyrgyzstan | 10450.86 (5376.27-17396.36) | 192.97 (99.34-320.71) | 14555.2 (7498.56-24298.02) | 192.76 (99.34-321.42) | 0 (0 to 0.01) |
| Lao People’s | 3830.22 (1952.68-6480.87) | 72.1 (36.93-121.36) | 5644.36 (2896.21-9744.53) | 71.97 (37.02-124.16) | 0 (0 to 0.01) |
| Democratic Republic Latvia | 856.22 (436.26-1462.37) | 38.7 (19.62-65.84) | 487.15 (251.45-838.44) | 38.56 (19.75-66.52) | -0.01 (-0.02 to -0.01) |
| Lebanon | 1995.19 (1033.62-3357.54) | 59.05 (30.51-99.6) | 2903.06 (1476.99-4912.39) | 59.15 (30.06-100.39) | 0 (0 to 0.01) |
| Lesotho | 908.06 (470.09-1535.64) | 45.61 (23.65-76.52) | 950.84 (490.11-1626.91) | 45.33 (23.4-77.46) | -0.01 (-0.02 to -0.01) |
| Liberia | 1438.89 (740.12-2496.25) | 44.94 (23.27-77.9) | 2971.8 (1526.55-5114.54) | 45.19 (23.38-77.24) | 0.02 (0.01 to 0.02) |
| Libya | 3260.62 (1677.29-5641.97) | 59.55 (30.65-103.37) | 3547.99 (1796.23-6198.22) | 59.32 (30.2-103.37) | -0.01 (-0.02 to -0.01) |
| Lithuania | 2718.06 (1395.74-4642.15) | 85.5 (43.87-146.13) | 1568.81 (806.71-2617) | 85.12 (43.35-141) | -0.01 (-0.01 to 0) |
| Luxembourg | 440.08 (228.68-730.52) | 147.88 (77-246.81) | 705.32 (366.03-1176.5) | 147.67 (76.6-248.28) | 0 (0 to 0) |
| Madagascar | 6602.75 (3413.5-10935.51) | 42.87 (22.22-71.38) | 15206.06 (7953.7-26440.93) | 43.14 (22.65-74.3) | 0.03 (0.03 to 0.03) |
| Malawi | 5405.4 (2702.46-9073.11) | 42.65 (21.51-72.24) | 10476.93 (5406.44-17556.08) | 43.06 (22.23-72.23) | 0.04 (0.04 to 0.05) |
| Malaysia | 14836.28 (7614.19-25097.72) | 71.7 (36.79-121.56) | 21168.5 (10944.67-36111.86) | 71.54 (36.8-122.17) | -0.01 (-0.02 to -0.01) |
| Maldives | 213.3 (110.73-370.35) | 71.2 (37.08-123.42) | 297.89 (155.45-508.18) | 69.86 (36.01-119.77) | -0.08 (-0.1 to -0.06) |
| Mali | 5637.04 (2880.55-9606.88) | 49.89 (25.62-84.32) | 15919.7 (8303.79-26849.82) | 49.75 (25.92-84.1) | -0.01 (-0.02 to 0) |
| Malta | 491.96 (255.97-815.11) | 147.97 (76.88-245.59) | 471.05 (244.97-790.56) | 147.74 (76.22-249.28) | -0.01 (-0.01 to 0) |
| Marshall Islands | 47.64 (24.47-81.55) | 75.62 (38.88-128.84) | 44.94 (23.09-76.92) | 75.71 (38.87-129.74) | 0 (0 to 0.01) |
| Mauritania | 1195.22 (608.56-2047.2) | 45.41 (23.21-78.17) | 2493.17 (1303.88-4176.56) | 45.72 (23.96-76.71) | 0.02 (0.01 to 0.02) |
| Mauritius | 815.93 (414.05-1397.04) | 71.68 (36.45-122.64) | 702.79 (366.52-1189.64) | 71.82 (36.95-122.07) | 0 (0 to 0.01) |
| Mexico | 72634.29 (37389.28-123418.68) | 70.35 (36.21-119.19) | 83145 (42838.98-139806.38) | 69.19 (35.65-116.51) | -0.08 (-0.09 to -0.07) |
| Micronesia (Federated States of) | 102.44 (52.91-170.26) | 75.57 (39.03-125.81) | 80.52 (41.53-136.09) | 75.77 (39.16-128.21) | 0 (0 to 0.01) |
| Monaco | 30 (15.48-50.32) | 147.85 (75.87-247.79) | 38.83 (20.47-64.82) | 148.14 (77.03-247.67) | 0.01 (0.01 to 0.02) |
| Mongolia | 5407.81 (2798.8-9153.02) | 192.19 (99.84-325.33) | 6984.03 (3581.25-11622.81) | 192.8 (98.97-321.28) | 0.01 (0.01 to 0.01) |
| Montenegro | 464.31 (239.67-788.47) | 79.62 (41.07-135.16) | 360.96 (187.12-609.11) | 79.51 (40.88-134.2) | 0 (-0.01 to 0) |
| Morocco | 18194.1 (9393.61-30526.17) | 59.4 (30.67-99.47) | 21098.57 (10818.38-35959.45) | 59.3 (30.44-101.15) | 0 (0 to 0) |
| Mozambique | 7384.68 (3800.17-12645.03) | 42.75 (22.19-73.03) | 17506.49 (9036.5-29665.61) | 42.87 (22.07-72.88) | 0.03 (0.02 to 0.03) |
| Myanmar | 33655.76 (17423.08-57252.72) | 71.7 (37.17-122.56) | 40322.9 (20854.64-68321.04) | 72.11 (37.34-122.33) | 0.02 (0.02 to 0.03) |
| Namibia | 816.63 (417.89-1373.39) | 45.43 (23.28-76.42) | 1235.16 (625.58-2117.1) | 45.57 (23.1-78.15) | 0.01 (0.01 to 0.01) |
| Nauru | 9.69 (4.97-16.26) | 75.78 (39.04-127.84) | 9.66 (4.95-16.41) | 75.81 (39-128.6) | 0 (0 to 0.01) |
| Nepal | 16444.24 (8531.95-28097.25) | 63.9 (33.07-109.12) | 20899.1 (10788.81-35288.66) | 64.61 (33.42-109.28) | 0.03 (0.03 to 0.04) |
| Netherlands | 17840 (9213.06-29727.4) | 148.1 (76.25-248.7) | 18870.3 (9860.47-31781) | 147.96 (76.15-250.69) | 0 (0 to 0) |
| New Zealand | 4483.84 (2294.53-74 86.97) | 146.26 (74.81-244.41) | 6097.97 (3147.78-10150.97) | 147.58 (75.76-245.99) | 0.05 (0.04 to 0.06) |
| Nicaragua | 4287.57 (2201.87-7128.19) | 81.97 (41.93-135.68) | 5635.66 (2860.83-9370.19) | 82.2 (41.75-136.42) | 0.01 (0 to 0.01) |
| Niger | 4941.8 (2551.48-8455.25) | 45.22 (23.2-76.42) | 15807.82 (8074.57-26920.48) | 45.57 (23.5-77.95) | 0.03 (0.02 to 0.03) |
| Nigeria | 51369.89 (26548.82-87133.96) | 45.65 (23.58-77.42) | 134904.83 (69754.82-227566.95) | 45.97 (23.78-77.36) | 0.03 (0.03 to 0.04) |
| Niue | 1.98 (1.03-3.38) | 75.93 (39.51-129.67) | 1.13 (0.58-1.88) | 75.82 (39.06-126.19) | 0 (0 to 0) |
| North Macedonia | 1493.73 (773.4-2504.01) | 79.5 (41.15-133.3) | 1139.27 (593.44-1919.48) | 79.32 (41.06-133.76) | 0 (-0.01 to 0) |
| Northern Mariana Islands | 33.69 (17.41-56.24) | 76.15 (39.09-128.1) | 32.38 (16.46-55.35) | 75.82 (38.46-128.72) | -0.02 (-0.03 to 0) |
| Norway | 5640.88 (2879.9-9376.56) | 162.11 (82.79-270.99) | 6833.7 (3493.1-11446.51) | 163.18 (83.38-274.92) | 0.03 (0.01 to 0.06) |
| Oman | 1464.73 (759.03-2405.52) | 57.77 (29.81-94.43) | 2593.51 (1311.45-4405.15) | 57.77 (29.18-98.54) | -0.03 (-0.05 to -0.01) |
| Pakistan | 95877.94 (49147.43-158260.61) | 63.75 (32.7-105.52) | 178464.05 (91846.51-300521.1) | 64.04 (32.98-107.87) | 0.02 (0.01 to 0.02) |
| Palau | 12.04 (6.2-19.99) | 75.81 (39-125.89) | 10.54 (5.37-17.9) | 75.32 (38.36-127.07) | -0.03 (-0.03 to -0.02) |
| Palestine | 1767.45 (905.61-2995.35) | 62.6 (32.27-105.55) | 3705.8 (1932.6-6281.81) | 61.6 (32.17-104.32) | -0.02 (-0.04 to -0.01) |
| Panama | 2214.18 (1137.59-3724.03) | 82.13 (42.08-138.66) | 3425 (1758.44-5735.01) | 82.1 (42.1-137.45) | 0 (0 to 0.01) |
| Papua New Guinea | 3860.34 (1996.98-6541.98) | 75.11 (38.72-126.96) | 9257.18 (4771.27-15661.2) | 75.41 (39.01-127.55) | 0.01 (0.01 to 0.01) |
| Paraguay | 5086.58 (2618.46-8446.76) | 104.8 (54.03-173.95) | 7453.36 (3890.85-12501.59) | 104.76 (54.63-175.42) | 0 (0 to 0) |
| Peru | 18364.5 (9321.26-30870.29) | 72.92 (37.16-122.51) | 25526.13 (13340.64-43149.98) | 73.02 (38.19-123.51) | 0.03 (0 to 0.05) |
| Philippines | 55489.49 (28917.6-93126.83) | 72.14 (37.59-120.74) | 84958.56 (43946.7-142139.25) | 72.17 (37.32-120.69) | 0 (0 to 0.01) |
| Poland | 27764.69 (14414.22-46606.9) | 80.48 (41.85-134.91) | 20352.83 (10580.69-34222.31) | 80.4 (41.88-133.63) | 0 (0 to 0) |
| Portugal | 12648.22 (6540.03-20800.85) | 147.72 (75.87-242.99) | 10793.8 (5624.76-17974.01) | 148.07 (76.46-248.88) | 0.01 (0 to 0.01) |
| Puerto Rico | 3008.93 (1556.02-5131.27) | 84.99 (43.87-144.73) | 2045.49 (1073.91-3434.48) | 84.81 (44.24-142.14) | 0 (0 to 0) |
| Qatar | 260.68 (132.86-433.22) | 58.65 (29.93-98.2) | 1327.51 (673.67-2232.28) | 58.86 (30.09-101.31) | -0.01 (-0.01 to 0) |
| Republic of Korea | 75702.64 (38906.38-127039.72) | 178.31 (91.52-298.25) | 60079.36 (31051.58-101144.94) | 178.59 (92.05-302.14) | 0.03 (0.01 to 0.05) |
| Republic of Moldova | 3742.21 (1910.31-6173.79) | 85.54 (43.6-141.17) | 2004.84 (1032.56-3311.37) | 85.11 (43.62-140.23) | -0.01 (-0.01 to -0.01) |
| Romania | 10838.94 (5500.35-18672.96) | 53.14 (26.96-91.46) | 6828.06 (3481.97-11754.86) | 53.93 (27.5-91.67) | 0.07 (0.06 to 0.09) |
| Russian Federation | 190226.42 (97787.62-316269.33) | 144.47 (74.12-240.17) | 157395.9 (80700.28-260654.57) | 148.92 (75.96-247.16) | 0.15 (0.11 to 0.2) |
| Rwanda | 2919.55 (1513.42-4905.46) | 30 (15.67-50.25) | 4720.11 (2431.02-8034.47) | 30.12 (15.45-51.39) | 0 (-0.04 to 0.04) |
| Saint Kitts and Nevis | 38.89 (20.17-66.18) | 84.8 (43.97-144.15) | 39.43 (20.63-67.09) | 84.87 (44.21-145.18) | 0 (0 to 0.01) |
| Saint Lucia | 135.49 (69.85-225.93) | 84.85 (43.82-141.16) | 118.62 (61.82-201.12) | 84.65 (43.88-143.92) | -0.01 (-0.01 to -0.01) |
| Saint Vincent and the Grenadines | 108.35 (55.97-181.01) | 84.84 (43.88-141.05) | 85.1 (43.95-142.12) | 84.61 (43.74-141.37) | -0.01 (-0.01 to 0) |
| Samoa | 162.33 (81.79-273.89) | 75.61 (38.26-127.26) | 190 (98.77-318.84) | 75.88 (39.53-127.17) | 0.01 (0.01 to 0.02) |
| San Marino | 27.6 (14.32-46.36) | 148.33 (76.29-251.2) | 33.69 (17.49-55.78) | 147.92 (77.25-247.16) | -0.01 (-0.01 to -0.01) |
| Sao Tome and Principe | 72.36 (36.92-123.97) | 45.67 (23.48-78.02) | 112.19 (57.72-188.9) | 45.69 (23.63-76.89) | 0.01 (0 to 0.01) |
| Saudi Arabia | 11924.95 (6019.46-19957.36) | 59.02 (29.89-99.48) | 18725.84 (9635.18-31404.96) | 58.98 (30.39-99.5) | 0 (-0.01 to 0) |
| Senegal | 4587.91 (2313-7750.11) | 45.26 (23.15-77.24) | 8671.91 (4525.96-14768.76) | 45.37 (23.76-77.59) | 0.01 (0.01 to 0.02) |
| Serbia | 6481.06 (3337.97-11127.09) | 80.17 (41.29-137.19) | 4592.29 (2344.03-7765.53) | 79.47 (40.48-131.84) | -0.03 (-0.04 to -0.03) |
| Seychelles | 57.36 (29.06-97.22) | 71.92 (36.44-121.83) | 65.38 (34.04-112.72) | 71.41 (37.11-122.97) | -0.04 (-0.04 to -0.03) |
| Sierra Leone | 2352.99 (1206.42-3998.22) | 45.21 (23.08-76.56) | 4885.31 (2516.05-8303.54) | 45.41 (23.44-77.05) | 0.02 (0.01 to 0.02) |
| Singapore | 3741.44 (1947.42-6300.58) | 144.51 (75.43-243.18) | 5613.44 (2893.26-9420.06) | 143.23 (73.22-240.14) | -0.04 (-0.05 to -0.03) |
| Slovakia | 3798.02 (1988.79-6468.36) | 79.79 (41.88-135.4) | 2903.22 (1499.93-4902.59) | 79.55 (40.64-133.56) | 0 (0 to 0) |
| Slovenia | 1263.73 (647.94-2138.39) | 79.65 (40.61-134.89) | 1071.64 (549.71-1808.88) | 79.45 (40.79-134.17) | -0.01 (-0.01 to 0) |
| Solomon Islands | 342.03 (174.32-569.8) | 75.59 (38.75-125.59) | 614.61 (315.24-1036.82) | 75.73 (38.81-127.99) | 0.01 (0.01 to 0.01) |
| Somalia | 4517.68 (2307.66-7624.18) | 42.68 (21.84-71.99) | 12386.53 (6421.41-21059.71) | 42.92 (22.31-73) | 0.02 (0.02 to 0.02) |
| South Africa | 19782.47 (10343.88-33523.2) | 45.54 (23.78-77.1) | 25019.59 (12969.85-42413.56) | 45.51 (23.57-77.11) | 0 (0 to 0) |
| South Sudan | 3200.81 (1685.89-5464.14) | 42.55 (22.41-72.92) | 5266.6 (2729.35-9069.5) | 42.8 (22.27-73.57) | 0.02 (0.02 to 0.02) |
| Spain | 44824.71 (22945.12-73667.76) | 139.52 (71.26-230.22) | 44238.9 (23000.79-73198.62) | 139.12 (71.96-231.86) | 0 (-0.01 to 0) |
| Sri Lanka | 13586.92 (6963.23-22599.04) | 73.02 (37.5-121.41) | 14388.34 (7385.79-24403.3) | 72.52 (37.33-122.81) | -0.04 (-0.05 to -0.03) |
| Sudan | 154 42.99 (8032.19-2 5747.83) | 58.99 (30.74-98.77) | 30938.89 (15917.68-52178.88) | 59.03 (30.37-99.29) | 0.01 (0.01 to 0.01) |
| Suriname | 360.73 (187.04-606.86) | 84.75 (44.15-141.42) | 454.05 (237.29-754.22) | 84.45 (44.16-140.1) | 0 (-0.01 to 0) |
| Sweden | 10132.57 (5197.09-16821.67) | 148.7 (75.87-248.04) | 12026.16 (6151.31-19732.41) | 148.64 (75.65-245.45) | 0 (-0.01 to 0) |
| Switzerland | 7859.1 (4149.7-13066.66) | 147.68 (77.36-248.2) | 9580.68 (4999.7-16065.83) | 147.66 (76.39-248.2) | 0 (0 to 0) |
| Syrian Arab Republic | 10278.33 (5317.73-17518.16) | 59.18 (30.66-100.44) | 7925.01 (4045.97-13384.85) | 59.35 (30.48-99.2) | 0.01 (0 to 0.01) |
| Taiwan (Province ofChina) | 20481.42 (10579.6-34111.93) | 101.89 (52.55-169.4) | 17788.25 (9250.37-29774.02) | 104.06 (53.35-174.32) | 0.18 (0.12 to 0.23) |
| Tajikistan | 13879.07 (7119.8-23722.55) | 192.39 (98.81-328.16) | 22523.58 (11644.36-38485.29) | 192.19 (99.57-327.69) | 0 (0 to 0) |
| Thailand | 42859.74 (22427.94-73558.74) | 72.11 (37.6-124.42) | 34891.32 (18228.78-59614.21) | 72.27 (37.36-124.17) | 0.01 (0.01 to 0.02) |
| Timor-Leste | 697.02 (355.28-1194.36) | 71 (36.44-121.57) | 1181.43 (616.5-1997.98) | 71.8 (37.67-121.3) | 0.05 (0.04 to 0.05) |
| Togo | 2148.82 (1087.23-3557.43) | 43.69 (21.98-72.6) | 4401.05 (2278.83-7645.11) | 43.82 (22.73-75.52) | -0.01 (-0.01 to 0) |
| Tokelau | 1.44 (0.74-2.44) | 75.96 (39.25-128.04) | 1.03 (0.52-1.73) | 75.66 (38.34-127.01) | -0.01 (-0.02 to -0.01) |
| Tonga | 95.18 (48.74-165.01) | 75.95 (38.9-131.18) | 93.74 (47.56-157.53) | 76.09 (38.58-127.45) | 0 (0 to 0.01) |
| Trinidad and Tobago | 1126.21 (578.84-1872.21) | 84.75 (43.69-140.93) | 982.48 (511.01-1631.53) | 84.57 (43.73-139.12) | 0 (0 to 0) |
| Tunisia | 5871.68 (2998.81-10178.45) | 59.32 (30.35-102.92) | 6231.47 (3195.12-10633.21) | 59.29 (30.34-100.71) | 0.01 (0 to 0.01) |
| Turkmenistan | 9127.4 (4689.82-15600.14) | 192.49 (99.33-327.64) | 10124.18 (5221.84-17016.79) | 191.7 (98.94-322.39) | -0.01 (-0.01 to -0.01) |
| Tuvalu | 8.3 (4.22-13.87) | 76.17 (38.78-127.17) | 9.71 (4.93-16.18) | 75.64 (38.42-126.12) | -0.01 (-0.02 to -0.01) |
| Türkiye | 62118.48 (32141.55-104526.73) | 94.03 (48.75-158.19) | 69694.07 (35866.74-116408.59) | 94.69 (48.63-157.57) | 0.01 (-0.01 to 0.02) |
| Uganda | 12570.58 (6317.67-21681.9) | 55.8 (28.53-96.32) | 31417.64 (16164.73-52675.57) | 56.27 (29.12-94.91) | 0.02 (0.01 to 0.04) |
| Ukraine | 38223.57 (19509.66-64484.5) | 86.79 (44.2-146.08) | 24128 (12347.81-40161.47) | 86.53 (43.92-144.19) | 0 (-0.01 to 0) |
| United Arab Emirates | 1183.24 (599.89-1963.2) | 58.71 (29.88-97.57) | 3859.25 (1964.09-6514.87) | 58.83 (29.86-100.09) | 0 (-0.01 to 0.01) |
| United Kingdom | 79573.36 (41067.36-131601.34) | 169.57 (87.09-281.31) | 87780.08 (45184.78-146768.1) | 166.44 (85.62-279.55) | -0.09 (-0.13 to -0.04) |
| United Republic ofTanzania | 20679.97 (10796.71-33893.48) | 62.02 (32.46-102.68) | 44939.51 (23028.82-74734.29) | 62.33 (32.17-103.23) | -0.02 (-0.05 to 0.01) |
| United States VirginIslands | 91.76 (46.94-152.46) | 85.07 (43.68-141.07) | 55.41 (28.79-92.66) | 84.7 (43.66-141.28) | -0.01 (-0.02 to -0.01) |
| United States of America | 321520.82 (165532.02-531870.16) | 137.61 (70.98-227.96) | 390321.8 (202080.45-641027.53) | 136.56 (70.53-224.92) | -0.05 (-0.08 to -0.02) |
| Uruguay | 4182.85 (2128.75-6996.12) | 140.67 (71.44-235.54) | 3954.24 (2056.18-6611.91) | 140.51 (72.56-237.05) | 0 (0 to 0) |
| Uzbekistan | 51971.13 (26777.35-88165.85) | 192.31 (99.31-324.35) | 67264.3 (34384.62-114193.5) | 192.15 (98.23-326.03) | 0 (0 to 0) |
| Vanuatu | 150.91 (76.97-250.33) | 75.72 (38.71-126.07) | 279.35 (143.63-470.24) | 75.9 (39.13-127.67) | 0.01 (0.01 to 0.01) |
| Venezuela (BolivarianRepublic of) | 22713.08 (11694.15-38192.49) | 102.97 (53.27-172.86) | 25208.24 (13075-42804.9) | 102.76 (53.36-174.81) | -0.02 (-0.02 to -0.01) |
| Viet Nam | 59271.57 (30388.85-102237.36) | 72.11 (37.14-124.51) | 66451.37 (34059.17-114518.93) | 71.96 (36.83-123.85) | -0.01 (-0.01 to 0) |
| Yemen | 11571.3 (5995.95-20016.98) | 58.54 (30.34-100.55) | 24694.87 (12836.17-43372.14) | 58.59 (30.35-102.25) | 0.01 (0.01 to 0.01) |
| Zambia | 4492.8 (2301.43-7558.88) | 42.9 (21.88-72.43) | 10534.05 (5464.59-17758.34) | 42.95 (22.35-72.58) | 0.03 (0.02 to 0.03) |
| Zimbabwe | 6370.17 (3248.89-10810.63) | 45.48 (23.2-77.45) | 8770.96 (4536.86-14893.72) | 45.48 (23.55-77.6) | 0 (0 to 0.01) |
Figure S1 Global disease burden of atopic dermatitis for both sexes in 204 countries and territories. (A) EAPC for prevalence. (B) EAPC for incidence. (C) EAPC for DALYs. Estimated annual percentage change (EAPC); Disability-adjusted life years (DALYs).
Figure S2 Association between ASPR, ASIR, age-standardized DALY rate and SDI in atopic dermatitis. Age-standardized rates of prevalence (ASPR); Age-standardized rates of incidence (ASIR); Disability-adjusted life years (DALYs); Socio-Demographic Index (SDI).
Figure S3 Association between ASPR, ASIR, age-standardized DALYs rate and SDI in atopic dermatitis for 204 countries and territories, in 2021. Age-standardized rates of prevalence (ASPR); Age-standardized rates of incidence (ASIR); Disability-adjusted life years (DALYs); Socio-Demographic Index (SDI).
Figure S4 Flow Chart.
Figure S5 Age-standardized rates of atopic dermatitis by sex, age group, and socio-demographic index, 1990 and 202. (A) Prevalence. (B) Incidence. (C) DALYs. Disability-adjusted life years (DALYs).