
Download
RESEARCH ARTICLE
Tolerance induction to LTP in patients with anaphylaxis: Serological response markers
Antonio Carbonell Martíneza*, Alejandra Gonzalez Perezb, Soledad Zamarro Parrab, RA Sola Martinezc
aAllergy Department, Hospital General Universitario Reina Sofía, Murcia, Spain
bHGU Reina Sofía de Murcia
cDepartment of Biochemistry and Molecular Biology B and Immunology, University of Murcia, Murcia, Spain
Abstract
Introduction: Allergy to lipid transfer proteins (LTP) is one of the leading causes of anaphylaxis in the Mediterranean region. Oral immunotherapy, sublingual immunotherapy (SLIT), with peach extract has emerged as a strategy to induce tolerance.
Objective: This study aimed to evaluate the efficacy of SLIT with peach extract and the usefulness of serological biomarkers as predictors of clinical response in patients with LTP-related anaphylaxis.
Methods: Observational study involving 80 patients diagnosed with LTP syndrome. Total IgE levels, specific IgE, and IgG4 specific to Pru p 3 were measured before and after 1 year of treatment. Patients were classified based on tolerance at the end of therapy.
Results: Sixty-one patients (76.3%) tolerated the final oral challenge. Baseline levels of total IgE, specific IgE, and IgG4 specific to Pru p 3 were significantly higher in the tolerance group. IgG4 levels increased significantly in both groups after treatment. Specific IgE levels increased only in the nontolerance group.
Conclusions: SLIT with peach extract may induce tolerance in the majority of patients with LTP allergy. Elevated baseline levels of total IgE, specific IgE, and IgG4 specific to Pru p 3 could serve as markers of clinical response.
Key words: Oral Immunotherapy, LTP Allergy, Pru p 3, Anaphylaxis, Serological Biomarkers, Specific IgE, Specific IgG4, Induced Tolerance
*Corresponding author: Antonio Carbonell Martínez, Allergy Department, Hospital General Universitario Reina Sofía, Murcia, Spain. Email address: [email protected]
Received 3 June 2025; Accepted 9 July 2025; Available online 1 November 2025
Copyright: Carbonell Martinez A, et al.
This open access article is licensed under Creative Commons Attribution 4.0 International (CC BY 4.0). http://creativecommons.org/licenses/by/4.0/
Introduction
Lipid transfer protein (LTP) allergy is an emerging and significant cause of food-induced anaphylaxis in young adults in the Mediterranean region, including Spain, Italy, and southern France, where its prevalence may reach up to 60% among patients allergic to Rosaceae fruits.1,2 These plant proteins are characteristically resistant to heat and gastric proteolysis, making them highly stable and capable of triggering severe systemic reactions even after ingestion of processed foods.3
Pru p 3, the LTP present in peach peel, is considered the prototype allergen of this group and the main trigger of clinical symptoms in sensitized individuals.4 In many cases, primary sensitization to Pru p 3 is associated with cross-reactivity to other plant LTPs found in nuts, legumes, and cereals, contributing to the clinical severity of the so-called “LTP syndrome.”5
Traditional management has focused on dietary avoidance. However, this does not prevent accidental exposures or improve patient quality of life. In recent years, sublingual immunotherapy (SLIT) has gained prominence as a therapeutic tool to induce clinical tolerance by modulating the adaptive immune response.6 Numerous studies have shown that SLIT can produce significant immunological changes, including reduction of specific IgE, increased blocking of IgG4, and induction of regulatory T cells (Tregs) and anti-inflammatory cytokines such as IL-10 and TGF-β.7,8
Despite its growing use, SLIT is not universally effective and lacks robust predictors of clinical efficacy. Immunological biomarkers such as baseline total IgE, IgE specific to Pru p 3, and specific IgG4 have been proposed as potential predictors of tolerance induction.9 Moreover, the evolution of these parameters during treatment may indirectly reflect its immunological efficacy.
Hypothesis
This study hypothesizes that baseline levels and posttreatment changes in total IgE, and IgE and IgG4 specific to Pru p 3 may predict clinical tolerance induced by SLIT.
Materials and Methods
Study design
We conducted a prospective, longitudinal, observational study in the Allergy Department of Hospital General Universitario Reina Sofía, Murcia, between January 2023 and June 2024. The protocol was approved by the Institutional Review Board (Code CE-2020-23), and all participants signed the informed consent.
Study Population: Inclusion and Exclusion Criteria
We included 80 adult patients (aged 18–55 years) with clinical and serological diagnosis of LTP-mediated allergy.
Inclusion criteria
-
Documented history of systemic reaction (generalized urticaria, angioedema, bronchospasm, or anaphylaxis) after ingestion of Rosaceae fruits
-
Positive skin test to standardized peach extract
-
Specific IgE to Pru p 3 > 0.35 kUA/L.
Exclusion criteria
-
Severe cardiovascular disease
-
Beta-blocker or ACE inhibitor treatment
-
Primary immunodeficiencies
-
Pregnancy or breastfeeding
-
Uncontrolled severe anaphylactic reactions.
Severity and Quality of Life Assessment
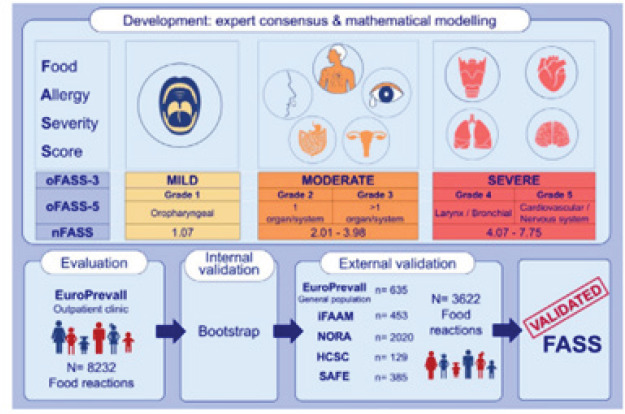
Initial reaction severity was graded using the Food Allergy Severity Score (FASS5), which categorizes reactions into five levels based on organ involvement and need for urgent care (Figure 1).10
Figure 1 Development and validation of the food allergy severity score.11
The quality of life was assessed using the validated Food Allergy Quality of Life Questionnaire – Adult Form (FAQLQ-AF), which comprised 29 items across four domains: food avoidance, emotional impact, perceived risk, and general health. Scores ranged from 1 to 7 (higher scores = worse quality of life).12
Immunological Evaluation
Peripheral blood samples were collected at baseline (Day 0) and after 12 months of SLIT (Day 365). The following parameters were measured:
-
Total IgE (kU/L)
-
Specific IgE to Pru p 3 (kUA/L)
-
Specific IgG4 to Pru p 3 (mg/L).
Measurements were performed using ImmunoCAP® (Thermo Fisher Scientific), a validated fluoroenzyme immunoassay for clinical use.13 The reference values were as follows: Total IgE <100 kU/L; Specific IgE <0.35 kUA/L; Specific IgG4 <0.15 mg/L.
Sublingual Immunotherapy protocol
We used a commercial standardized peach extract containing 8 μg of Pru p 3 per daily dose. The administration protocol included the following:
-
Ultra-rapid induction phase (Day 1): Progressive dose escalation under medical supervision.
-
Maintenance phase (12 months): Fixed daily dose at home.
This accelerated schedule has shown safety and efficacy in LTP-allergic patients, shortening the sensitization period without compromising tolerability.14,15
Oral Challenge Test
At the end of treatment, all patients underwent an open oral challenge with commercial peach juice (Granini®) following this local protocol:
-
Day 1: 5, 10, 15, 30, and 60 mL every 15 min.
-
Day 2: 80 and 100 mL every 15 min; repeat 100 mL at 30 min.
Patients were monitored continuously, with emergency treatment available. The challenge was stopped upon objective reactions, such as urticaria, angioedema, bronchospasm, and hypotension.
Group Assignment
Patients were divided based on the challenge results.
-
Group A (Tolerant): Completed the protocol without reactions
-
Group B (Nontolerant): Developed clinical reactions requiring interruption.
Statistical Analysis
Comparative statistical analysis was conducted to identify predictive biomarkers of tolerance. Analyses were performed in RStudio (version 4.0.5). Normality of continuous variables was assessed via the Shapiro–Wilk test. Depending on the distribution, t-tests or nonparametric alternatives (Mann–Whitney U, Wilcoxon) were used. Categorical variables were analyzed using Fisher’s exact test. The significant threshold was P < 0.05.
Results
Population characteristics
Of the 80 patients, 61 (76.3%) were classified as tolerant (Group A) and 19 (23.7%) as nontolerant (Group B). Mean age: 34.6 ± 10.2 years; 70% were females. No significant differences in age or sex were found between groups.
Table 1 Demographic and clinical characteristics of the sample by group.
Table 1 Comparison of clinical and immunological variables between tolerant and nontolerant groups.
| Variable | Tolerance group (n = 61) | Nontolerance Group (n = 19) | P |
|---|---|---|---|
| Sex (Female/Male) | 44 (72.1%)/17 (27.9%) | 17 (89.5%)/2 (10.5%) | 0.215 |
| Age (mean ± SD) | 35.2 ± 13.0 | 39.1 ± 8.1 | 0.119 |
| FAQLQ (mean ± SD) | 137.7 ± 27.2 | 142.4 ± 29.3 | 0.366 |
| FAQLQ/29 (mean ± SD) | 4.7 ± 0.9 | 4.9 ± 1.0 | - |
| Total IgE baseline (mean ± SD) | 271.7 ± 273.1 | 127.4 ± 130.7 | 0.031 |
| Total IgE at challenge (mean ± SD) | 257.6 ± 298.3 | 125.8 ± 106.0 | 0.080 |
| Δ Total IgE (mean ± SD) | −14.1 ± 166.1 | −1.5 ± 93.3 | 0.603 |
| Specific IgE Pru p 3 baseline (mean ± SD) | 13.3 ± 20.1 | 9.3 ± 19.1 | 0.046 |
| Specific IgE Pru p 3 at challenge (mean ± SD) | 13.6 ± 19.5 | 14.8 ± 19.4 | 0.923 |
| Δ Specific IgE Pru p 3 (mean ± SD) | 0.3 ± 10.7 | 5.6 ± 15.1 | 0.071 |
| Specific IgG4 Pru p 3 baseline (mean ± SD) | 1.39 ± 2.84 | 0.42 ± 0.53 | 0.011 |
| Specific IgG4 Pru p 3 at challenge (mean ± SD) | 1.92 ± 3.60 | 0.74 ± 0.79 | 0.082 |
| Δ Specific IgG4 Pru p 3 (mean ± SD) | 0.53 ± 1.39 | 0.32 ± 0.67 | 0.756 |
Mean values ± standard deviation are presented. Significant differences between groups were observed in baseline total IgE (pP = 0.031), baseline specific IgE to Pru p 3 (P = 0.046), and baseline specific IgG4 to Pru p 3 (P = 0.011).
Baseline immunological levels
At baseline, Group A had significantly higher levels of:
-
Total IgE: 230.1 ± 88.7 kU/L vs 151.6 ± 74.2 kU/L (P < 0.01)
-
Specific IgE to Pru p 3: 8.5 ± 3.1 kUA/L vs 4.3 ± 2.7 kUA/L (P < 0.01)
-
Specific IgG4 to Pru p 3: 0.30 ± 0.12 mg/L vs 0.12 ± 0.06 mg/L (P < 0.01)
These results suggest greater baseline immunological reactivity in patients who achieved tolerance.
Table 2 Comparison of basal immune levels between Groups A and B.
Table 2 Comparison between baseline and pre-challenge values in the tolerant group.
| Variable | Baseline | Final | P |
|---|---|---|---|
| Total IgE (mean ± SD) | 271.7 ± 273.1 | 257.6 ± 298.3 | 0.494 |
| Specific IgE Pru p 3 (mean ± SD) | 13.3 ± 20.1 | 13.6 ± 19.5 | 0.606 |
| Specific IgG4 Pru p 3 (mean ± SD) | 1.39 ± 2.84 | 1.92 ± 3.60 | 0.002 |
A significant increase in specific IgG4 to Pru p 3 was observed (P = 0.002).
Post-treatment immunological evolution
After 12 months of SLIT:
-
Specific IgG4 to Pru p 3 significantly increased in both groups (Group A: 0.61 mg/L, P = 0.002; Group B: 0.35 mg/L, P = 0.033), with a greater rise in Group A.
-
Specific IgE remained stable in Group A (P = 0.61) but showed an upward trend in Group B (P = 0.067).
-
Total IgE showed no significant changes in either group.
Table 3 Pre- and posttreatment comparison of immunological parameters.
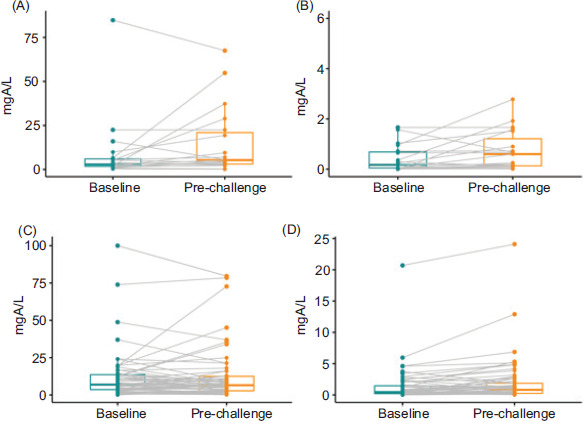
Figure 2 Individual evolution graphs of specific IgE and specific IgG4 in Groups A and B, with medians and interquartile ranges.
Table 3 Comparison between baseline and prechallenge values in the nontolerant group.
| Variable | Baseline | Final | P |
|---|---|---|---|
| Total IgE (mean ± SD) | 127.4 ± 130.7 | 125.8 ± 106.0 | 0.925 |
| Specific IgE Pru p 3 (mean ± SD) | 9.3 ± 19.1 | 14.8 ± 19.4 | 0.067 |
| Specific IgG4 Pru p 3 (mean ± SD) | 0.42 ± 0.53 | 0.74 ± 0.79 | 0.033 |
A significant increase in specific IgG4 to Pru p 3 was observed (p = 0.033).
Figure 2 Changes in specific IgE and IgG4 levels against Pru p 3 in tolerant and nontolerant groups. (A) IgE levels against Pru p 3 in the tolerant group. (B) IgG4 levels against Pru p 3 in the tolerant group. (C) IgE levels against Pru p 3 in the nontolerant group. (D) IgG4 levels against Pru p 3 in the nontolerant group. Values are expressed in ngA/L. Medians, interquartile ranges, and individual values are shown, with lines connecting each patient’s baseline and final values. Statistical analysis was performed using the Wilcoxon signed-rank test. A significant increase in IgG4 was observed in both groups (b and d), but not in IgE.
Clinical Correlations
A weak positive correlation was observed between baseline specific IgE to Pru p 3 and FAQLQ score (r = 0.28; P = 0.04), indicating that higher sensitization correlated with poorer quality of life.
An inverse moderate correlation was found between increased specific IgG4 and oral challenge reactivity (r = −0.42; P = 0.01), supporting its value as a tolerance marker.
Discussion
Our findings support SLIT with peach extract as a safe and effective strategy to induce clinical tolerance in LTP syndrome. Higher baseline levels of total IgE, and specific IgE and IgG4 in tolerant patients suggest a more modifiable immune profile.6,9
SLIT induces tolerance via several mechanisms, such as Treg activation, IL-10/TGF-β secretion, Th2-to-Th1 shift, and IgG4 blocking antibody production.7,8 The increase in IgG4 in both groups reflects immunomodulatory exposure, though its predictive value is limited due to overlap in nontolerant patients.
Stabilization of specific IgE in tolerant patients versus its increase in nontolerant ones may serve as a more specific marker of a favorable response.
The correlation between specific IgE levels and FAQLQ scores confirms the clinical relevance of sensitization. Meanwhile, IgG4 rise correlated inversely with reactivity, suggesting a functional protective role.
These results align with previous studies, including Gómez et al.,9 who demonstrated that a low specific IgE/IgG4 ratio after SLIT correlates with tolerance. Future strategies may include functional biomarkers such as basophil activation tests and Treg profiling.13
Clinical Implications and Future Directions
SLIT appears to be a safe and potentially effective approach for LTP-induced anaphylaxis. We propose an immunological profile that may help select ideal candidates and guide monitoring. Further multicenter, controlled studies should validate these findings and incorporate advanced molecular biomarkers.
Conclusions
Ultra-rapid SLIT with standardized peach extract followed by a 12-month maintenance phase proved to be a safe and effective strategy for inducing clinical tolerance in patients with LTP-mediated anaphylaxis. The majority of patients tolerated the treatment and successfully passed the oral challenge, confirming the clinical benefit of this therapeutic approach.
Our findings suggest that patients who develop tolerance exhibit a more dynamic and responsive baseline immune profile, characterized by higher levels of total IgE, and IgE and IgG4 specific to Pru p 3. These patients also demonstrated a more favorable immunological evolution during treatment, particularly stabilization of specific IgE and a significant increase in blocking IgG4 antibodies.
The observed correlations between immunological parameters and clinical outcomes underscore the potential of serological biomarkers as tools for patient stratification and treatment monitoring. Specific IgG4 to Pru p 3, in particular, appears to be a promising indicator of immunological shift, though its predictive value is limited when used in isolation. Conversely, the lack of a significant increase in IgE and a greater IgG4 rise in tolerant patients support the utility of dynamic changes, rather than absolute values alone, in assessing treatment response.
These results highlight the importance of integrating immunological monitoring into routine clinical practice to guide decision-making and personalize therapy. The development of predictive algorithms based on serological markers, complemented by functional assays such as basophil activation tests or Treg cell profiling, could further refine patient selection and optimize SLIT outcomes.
Nonetheless, these findings must be interpreted in the context of a single-center study. Long-term, multicenter trials with larger populations and standardized protocols are essential to validate these results and incorporate advanced molecular and cellular biomarkers into allergy immunotherapy frameworks.
In summary, the integration of clinical outcomes with immunological profiling offers a promising path toward precision medicine in the management of LTP-mediated food allergy.
Author’s Contribution
All authors contributed equally to this article.
Conflicts of Interest
There are no conflicts of interest to disclose.
Funding
No funding was recieved for carrying out the study.
REFERENCES
1 Asero R, Pravettoni V, Scala E, Villalta D. Lipid transfer protein allergy in the Mediterranean area. Clin Exp Allergy. 2020;50(7):720–30. 10.1111/cea.13640
2 Skypala IJ. Food-induced anaphylaxis: Role of LTP. Curr Opin Allergy Clin Immunol. 2021;21(3):240–6. 10.1097/ACI.0000000000000732
3 Salcedo G, Sanchez-Monge R, Diaz-Perales A, Garcia-Casado G, Barber D. Stability of plant food allergens. Clin Exp Allergy. 2004;34(9):1336–41. 10.1111/j.1365-2222.2004.02018.x
4 Fernández-Rivas M, et al. Relevance of Pru p 3 in systemic peach allergy. Allergy. 2006;61(3):354–8. 10.1111/j.1398-9995.2005.00974.x
5 Vereda A, et al. Cross-reactivity patterns in LTP allergy. Eur Ann Allergy Clin Immunol. 2023;55(2):86–93. 10.23822/EurAnnACI.1764-1489.278
6 Fernández-Rivas M. SLIT in food allergy: Evidence and mechanisms. Curr Opin Allergy Clin Immunol. 2018;18(3):208–14. 10.1097/ACI.0000000000000449
7 Akdis CA, Akdis M. Immunological mechanisms of allergen-specific immunotherapy. J Allergy Clin Immunol. 2011;127(1):18–27. 10.1016/j.jaci.2010.11.023
8 Palomares O, et al. Regulatory T cells in tolerance induction. Clin Exp Allergy. 2017;47(6):740–53. 10.1111/cea.12932
9 Gómez F, et al. Specific IgE/IgG4 ratio as predictor in LTP SLIT. Clin Exp Allergy. 2017;47(3):339–50. 10.1111/cea.12862
10 Worm M, et al. Food-induced anaphylaxis severity score (FASS): Validation. Clin Exp Allergy. 2015;45(10):1620–8. 10.1111/cea.12506
11 Fernández-Rivas M, García IG, Gonzalo-Fernández, A, Ferrer MF, Dölle-Bierke S, et al. Development and validation of the food allergy severity score. Allergy. 2022;77(5):1545–58. 10.1111/all.15165
12 DunnGalvin A, et al. Development of the FAQLQ questionnaire. Clin Exp Allergy. 2008;38(7):977–86. 10.1111/j.1365-2222.2008.03093.x
13 Hamilton RG. Clinical utility of ImmunoCAP in allergy diagnostics. Clin Allergy Immunol. 2018;30:45–64. 10.1007/978-3-319-74715-5_3
14 Cubells L, et al. Rapid SLIT induction in LTP allergy. Allergol Immunopathol (Madr). 2016;44(4):319–26. 10.1016/j.aller.2015.07.007
15 Zamarro Parra MS, Petryk Petryk Y, Carbonell Zamoran J, Carbonell Martinez A. Ultrafast regimen for Pru p3 sublingual immunotherapy (SLIT-Peach®) in patients with anaphylactic LTP-Syndrome. Eur Ann Allergy Clin Immunol. 2024;56(4):183–7. 10.23822/EurAnnACI.1764-1489.285