
Download
ORIGINAL ARTICLE
Determining specific IgE cutoff values to predict reactions in oral food challenges for cow’s milk allergy using the Immulite System
Gökhan Yörüsüna*, Ragıp Derea, Hatice Irmak Celika, Ahmet Selmanoglua, Ozge Yılmaz Topala, Zeynep Sengül Emeksiza, Emine Dibek Mısırlıoglub
aDepartment of Pediatric Allergy/Immunology, Ankara Bilkent City Hospital, University of Health Sciences, Ankara, Turkey
bDepartment of Pediatric Allergy/Immunology, Ankara City Hospital, Ankara Yıldırım Beyazıt University, Ankara, Turkey
Abstract
The diagnosis of IgE-mediated cow’s milk allergy (CMA) involves serum-specific IgE (spIgE), skin prick tests (SPT), and the gold standard oral food challenge (OFC). SpIgE levels are measured using methods such as ImmunoCAP and IMMULITE, with most cutoff data derived from ImmunoCAP. This study aims to determine IMMULITE-specific cutoff values to predict OFC positivity. Patients diagnosed with CMA via OFC between 2019 and 2023 were retrospectively analyzed. Data on demographics, eosinophil counts, total and specific IgE levels, and SPT results were collected. OFC was conducted using yogurt, milk-based formula, or milk-containing muffins. SPTs were performed with commercial extracts (Lofarma®) and pasteurized milk using the prick-to-prick method. SpIgE levels were measured with the Siemens® IMMULITE 2000 Immunoassay System, with values ≥0.35 kU/L considered positive. The study included 50 OFC-positive patients (60% males) and 50 age- and clinically matched controls without objective OFC reactions. The median age at diagnosis was 6 months (IQR: 3–21), and 52% presented with atopic dermatitis. OFC reactions occurred with yogurt in 42 patients (84%), muffins in 6, and milk in 2; 26% of reactions were anaphylaxis. IMMULITE-derived cutoff values were 3.13 kU/L (AUC: 0.776, 72% sensitivity, 72% specificity) for cow’s milk spIgE and 1.85 kU/L for casein. SPT enduration cutoffs were 4.25 mm for pasteurized milk and 3.5 mm for commercial extracts. This study provides critical IMMULITE-specific spIgE cutoffs to predict OFC outcomes, offering valuable reference ranges for clinical CMA diagnosis.
Key words: cow’s milk allergy, immulite, cutoff, oral food challenge
*Corresponding author: Gökhan Yörüsün, Department of Pediatric Allergy/Immunology, Ankara Bilkent City Hospital, University of Health Sciences Ankara, Turkey. Email address: gö[email protected]
Received 25 May 2025; Accepted 12 August 2025; Available online 1 November 2025
Copyright: Yörüsün G., et al.
This open access article is licensed under Creative Commons Attribution 4.0 International (CC BY 4.0). http://creativecommons.org/licenses/by/4.0/
Introduction
Cow’s milk allergy (CMA) is the most common childhood food allergy, with a prevalence of up to 2.5% when considering both IgE- and non-IgE-mediated reactions.1 Although CMA predominantly manifests during infancy and early childhood, recent evidence indicates a rising prevalence of food allergies in the adult population. A population-based study conducted in the United States reported an overall food allergy prevalence of approximately 10% among adults, with milk allergy accounting for 1.9% of the cases.2 The Europrevall birth cohort study conducted in Europe reported a challenge-proven CMA incidence of approximately 0.54% in the first 2 years of life, with frequency varying by region, dietary habits, and age.3
IgE-mediated CMA presents with a wide spectrum of clinical manifestations, ranging from mild symptoms involving the skin, gastrointestinal tract, or respiratory and cardiovascular systems, to less frequent but potentially life-threatening anaphylactic reactions. A meta-analysis reported a recurrence rate of 26.98% for cow’s milk-induced anaphylaxis, highlighting the severe and potentially fatal nature of CMA.4
Nevertheless, the development of tolerance over time is frequently observed in IgE-mediated CMA. Studies to date have shown that approximately 20% of infants diagnosed with CMA develop tolerance within the first year, 50% by the age of five, and more than 75% by adolescence. Failure to accurately identify the development of tolerance may lead to unnecessarily prolonged elimination of cow’s milk from the diet.5
This clinical heterogeneity and unnecessary dietary elimination may significantly impair the quality of life of both patients and their caregivers. Therefore, establishing an accurate diagnosis of CMA is crucial for its appropriate management and to avoid unwarranted dietary restrictions.6
In the diagnosis of reactions mediated by CMA, specific IgE (spIgE) measurement and the skin prick test (SPT) are commonly used. The SPT can be performed directly with milk or with commercial allergen extracts. For spIgE measurement in serum, the two primary systems generally used are ImmunoCAP and Immulite 2000. ImmunoCAP is considered a classic method due to its widespread use in comparative studies with skin testing.7 Immulite 2000 is a chemiluminescent enzyme immunoassay developed for the detection of spIgE in the liquid phase and is calibrated according to the relevant WHO international reference preparation.8 Previous studies have demonstrated that the IMMULITE method shows good concordance rates in patients with tree nut allergies, with agreement rates of 85% for cashew, 87% for pistachio, and 90% for walnut allergies.9 Both systems have the same calibration scale, which ranges from 0 to 100 kUA/L; however, they differ in their methods of allergen binding and detection techniques.7
Although some comparative studies between the IMMULITE and ImmunoCAP methods have reported higher sensitivity in favor of IMMULITE for certain allergens such as cat dander, birch pollen, peanut, and egg white, inconsistencies in measurement results have been observed depending on the specific allergen tested. These discrepancies vary according to the type of allergen and the study population. Therefore, large-scale comparative studies involving a broad range of allergens are essential to better understand the differences between the two methods and to ensure reliable diagnostic outcomes in allergic diseases.10–12 However, both spIgE measurement and the SPT only confirm sensitivity; they do not provide a clinical diagnosis of allergy. The gold standard test for the diagnosis of CMA is the oral food challenge (OFC).13 The OFC is an essential test used in both the diagnosis and assessment of food tolerance. Although it is considered the gold standard, the OFC requires an appropriate setting to manage potential allergic reactions, which can sometimes be severe. Given these risks, spIgE cutoff points have been established to predict reactions during an OFC. These cutoff points aid diagnosis and serve as tools for evaluating food tolerance.14,15
In the literature, cutoff values determined by the ImmunoCAP method to predict CMA confirmed by OFC are more frequent, while data on Immulite are limited.15,16 In our study, we aimed to determine spIgE cutoff points measured using the Immulite method to predict reactions in an OFC.
Material and Methods
This study was conducted at the Paediatric Allergy and Immunology Clinic of Ankara Bilkent City Hospital. Ethical approval was granted by Ankara City Hospital Clinical Trials (decision number TABED 1-24-80). The study was conducted in accordance with the principles of the Declaration of Helsinki.
Study population
The study included patients who developed reactions during OFCs with milk and dairy products due to CMA between September 2019 and December 2023, as well as patients with similar clinical characteristics who showed no reactions during milk OFCs, matched in numbers. The no-reaction group served as the control group for the reaction group. Demographic characteristics, complaints on admission, food form (baked milk, yogurt and milk) used during the OFC, the characteristics of the reactions developed during the OFC, and additional food allergies were recorded. If available, eosinophil count, total IgE, milk spIgE, casein spIgE, and pasteurized milk and commercial allergen extract SPT results were also evaluated.
Patients with spIgE levels >100 kU/L, those who refused to undergo tolerance OFCs, and those who had developed anaphylaxis with milk and dairy products in the past 6 months were excluded from the study, as tolerance OFCs could not be performed in these cases.
Allergy evaluation
SpIgE and skin prick test
SpIgE was measured using the Immulite 2000 Immunoassay System (Siemens Healthcare Diagnostics, Tarrytown, NY, USA) and was considered positive at values of 0.35 kU/L and above. The SPTs were performed with commercial preparations (Lofarma, Milan, Italy, 1945) and pasteurized milk using the prick-to-prick method according to the guidelines of the European Academy of Allergy and Clinical Immunology (EAACI), at least 4–6 weeks after the anaphylactic reaction, with antihistamines stopped 1 week before testing. In younger children, the SPT was performed on the back; in older children, it was performed on the volar surface of the forearm. Induration accompanied by erythema with a mean diameter of 3 mm or greater was considered positive.17,18
Oral food challenge
After obtaining written and verbal informed consent from parents, OFCs were conducted using baked milk, yogurt, and dairy milk or milk-based formula that the patient could tolerate according to their age and clinical findings.
-
Baked milk: Each muffin contained 1.3 g of milk protein. The muffin was baked at 200°C for 30 min in an oven. The muffin was first administered in fractions of 1/8, followed by feeding the remaining portions in increasing amounts of 1/8, ¼, and 1/2 at 15 min intervals, which resulted in the consumption of the whole muffin.19
-
Yogurt: Children over 4–6 months of age were served Turkish yogurt (45 g) containing 1.35–2.1 g of milk protein. The yogurt was administered starting at 1 g, with subsequent doses of 4, 10, 10, and 20 g, given at 15 min intervals. For older children, the portion was increased to a maximum of 50 g to complete the serving.20
-
Dairy milk or formula: After a physical examination of the undressed infant, with inspection of the skin, a drop of dairy milk or formula was put on their lips. If no reaction occurred after 15 min, the dairy milk or formula was given orally, and the dose was increased stepwise. If no reaction occurred, the child received at least 250 mL of dairy milk or formula each day for the next week, and the parents were told to observe the child for late reactions.21
The subjects were monitored throughout and for 2–4 h after the completion of the final challenge. The challenges were discontinued at the first objective sign of a reaction, and treatment was initiated immediately.
Statistics
The analysis was conducted using SPSS Statistics version 22.0 (IBM, Armonk, NY, USA). For categorical variables, numbers and percentages are reported. Continuous variables are expressed as means, minimums and maximums in the case of normally distributed data, while non-normally distributed data are presented as medians and interquartile ranges (IQRs, 25th–75th percentile values). Categorical data are expressed in terms of frequencies and proportions, while continuous data are reported as means and standard deviations. The validity of the assumption of normality was evaluated with the Kolmogorov–Smirnov test or the Shapiro–Wilk test. The normality of each variable in the dataset was examined, and the variables that did not conform to a normal distribution were analyzed using nonparametric tests. The Mann–Whitney U test was applied for binary-independent group comparisons. Pearson’s correlation coefficient was employed to measure the linear correlation between the patients’ tests. Receiver operating characteristic (ROC) analysis was used to determine the diagnostic performance of the IMMULITE test, including calculation of the area under the curve (AUC). The Youden index (J = Sensitivity + Specificity – 1) was applied to identify the optimal cutoff point. At this point, sensitivity was calculated as the proportion of true positive results among all actual positives (i.e., sensitivity = true positives/[true positives + false negatives]), and specificity was calculated as the proportion of true negative results among all actual negatives (i.e., specificity = true negatives/[true negatives + false positives]). These parameters were used to evaluate the test’s ability to discriminate between positive and negative outcomes.
Results
In total, 50 patients, 60% of whom were males (n: 30), were included in the study. The median age at diagnosis was 6 months (IQR: 3–21). The OFC was performed at a median of 9 months (IQR: 7–17.2) after admission to assess CMA.
The median age at the time of the OFC was 14 months (IQR: 12–20). Among the patients, 42 (84%) were diagnosed with CMA due to the development of objective reactions during the OFC with yogurt, 6 (12%) during the OFC with the muffin and 2 (4%) during the OFC with milk. Of the reactions causing objective findings, 38 (76%) were evaluated as urticaria and 12 (24%) as anaphylaxis. Of the patients detailed in Table 1, 52% (n: 26) presented with complaints of atopic dermatitis or eczema, and 54% (n: 27) had concomitant egg allergies.
Table 1 Demographic characteristics of the patients and distribution according to presenting complaints.
| Parameters | OFC positive group | OFC negative group |
|---|---|---|
| Age at diagnosis (median, IQR) | 6 (3-21) | 7 (4-9) |
| Sex n (%) | ||
| Male | 30 (60) | 28 (56) |
| Presenting complaints n (%) | ||
| Atopic dermatitis | 26 (52) | 25 (50) |
| Urticaria/Angioedema | 19 (38) | 22 (44) |
| Anaphylaxis | 5 (10) | 3 (6) |
| Concomitant food allergy n (%) | ||
| Egg | 21 (42) | 22 (44) |
| Egg + nuts and/or peanuts | 5 (10) | 6 (12) |
| Egg + lentils | 1 (2) | 0 (0) |
| Reaction characteristics during | OFC and dairy products | |
| n (%) | ||
| Urticaria n (%) | 38 (76) | |
| Baked milk | 4 (8) | |
| Yogurt | 32 (64) | |
| Milk | 2 (4) | |
| Anaphylaxis n (%) | 12 (24) | |
| Baked milk | 2 (4) | |
| Yogurt | 10 (20) | |
| Milk | 0 (0) | |
IQR: Interquartile range; OFC: Oral food challenge.
The median total IgE level in patients was 73.5 (IQR: 28.3–374.4); the eosinophil count was 360 × 109/L (IQR: 182–535), and the eosinophil percentage was 3.2% (IQR: 2–6.6). In the diagnostic allergy studies, the average SPT with commercial CM extract was 4.3 mm (±2), while the average SPT with pasteurized CM was 6 mm (±2.8). The in vitro tests showed that the median CM spIgE value was 8.4 kU/L (IQR: 2.8–41.7), while casein spIgE was measured in 22 (44%) patients, with a median value of 10.4 kU/L (IQR: 2.3–34.2). As summarized in Table 2, the median CM spIgE, casein spIgE, and total IgE values were found to be higher in the patients who experienced anaphylaxis during the OFCs.
Table 2 Reaction characteristics and tests during OFC.
| Parameters | Urticaria | Anaphylaxis | P* |
|---|---|---|---|
| n: 38 | n: 12 | ||
| Median (IQR) | Median (IQR) | ||
| Eosinophil (x109/L) | 320 (160-480) | 420 (225-680) | 0.256 |
| Total IgE (lU/mL) | 45 (21.7-150.3) | 409 (196.5-667.5) | 0.001* |
| Commercial solution SPT (mm) | 4 (3-6) | 4.75 (3-5) | 0.756 |
| Pasteurized milk SPT (mm) | 5.5 (4-6.5) | 6 (5-10.5) | 0.108 |
| CM spIgE (kU/L) | 5.7 (2.4-13.9) | 65.5 (34.3-87) | <0.001* |
| Casein spIgE (kU/L) | 2.8 (1-10.4) | 44 (25.4-63.6) | 0.001* |
*Mann–Whitney U test.
IQR: Interquartile range; OFC: Oral food challenge; SPT: Skin prick test.
A strong correlation was found between CM spIgE and casein spIgE (r: 0.915, P < 0.01); a moderate correlation was identified between CM spIgE and total IgE (r: 0.590, P < 0.01), and a weak correlation was determined between CM spIgE and the pasteurized CM SPTs (r: 0.416, P < 0.01) as well as the commercial solution SPTs (r: 0.355, P < 0.01).
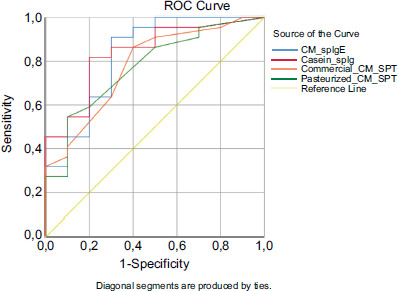
A negative OFC group was formed with 50 patients who had similar clinical characteristics, with a median age of 7 months (IQR: 4–9) and a median CM spIgE of 1.3 kU/L (IQR: 0.63–5.1), who underwent tolerance OFCs with milk and dairy products and did not develop any objective reactions. ROC curve analysis was performed to determine the sensitivity and specificity of spIgE and the SPTs across the two groups. Sensitivity and specificity were evaluated for CM spIgE, casein spIgE, the SPTs with pasteurized CM and the SPTs with commercial CM extract. In the ROC curve analysis conducted to determine the cutoff points, the spIgE concentrations were found to be 3.13 kU/L for CM and 1.85 kU/L for casein. For the SPTs, the cutoff values were 4.25 mm for pasteurized CM and 3.5 mm for commercial CM extract. The details are summarized in Table 3 and Figure 1.
Table 3 Area under the curve, cutoff, sensitivity, and specificity values obtained from ROC curves of CM, casein spIgE measured by Immulite technique, and pasteurized CM, commercial CM extract SPT.
| Parameters | AUC (%95 CI) | Cutoff | p* | Sensitivity % | Specificity % |
|---|---|---|---|---|---|
| CM spIgE (kU/L) | 0.776 (0.686-0.866) | 3.13 | <0.01 | 72 | 72 |
| Casein spIgE (kU/L) | 0.839 (0.693-0.985) | 1.85 | <0.01 | 81 | 80 |
| Pasteurized milk SPT (mm) | 0.738 (0.641-0.835) | 4.25 | <0.01 | 78 | 56 |
| Commercial solution SPT (mm) | 0.708 (0.607-0.809) | 3.5 | <0.01 | 68 | 62 |
AUC: Area under the curve; CI: Confidence interval; spIgE: Specific IgE; SPT: Skin prick test.
Figure 1 Receiver operating characteristic curves.
Discussion
Oral food challenges are primarily conducted to diagnose food allergies, determine sensitivity levels, and assess tolerance.22 An OFC is considered positive in the event of an objective clinical reaction, which confirms the diagnosis of food allergy and the need for dietary elimination. A positive OFC can alleviate uncertainty and anxiety for the patient and their family, helping to reduce accidental exposures.19 Therefore, to better characterize and confirm the rising prevalence of allergy to CM, we aimed to determine predictive cutoff points using the Immulite method for CM.
In the study by Castro et al., which involved 184 patients referred due to suspected IgE-mediated hypersensitivity reactions, 123 patients were diagnosed with CMA based on criteria including positive DBPCFC, a history of anaphylaxis to CM within the past year, and positive reactions to an SPT and an OFC. In this study, 21.2% of patients were diagnosed through DBPCFC. The spIgE cutoff value for CM, measured using the ImmunoCAP system, was determined to be 3.06 kU/L, with a sensitivity of 71.3% and specificity of 98.3%. For casein, the spIgE cutoff value was found to be 1.47 kU/L, with a sensitivity of 60.3% and specificity of 98.3% (AUC for CM: 0.92; AUC for casein: 0.849).15 In our study, the CM spIgE cutoff value was 3.13 kU/L, with 72% sensitivity and specificity, while the casein spIgE cutoff value was 1.85 kU/L, with 81% sensitivity and 80% specificity. Although the sensitivity and specificity values are lower compared to those of the study by Castro et al., the cutoff values are similar. Additionally, since the open OFC was performed for all the patients in our study, our findings might be interpreted differently compared to those of the study by Castro et al.
In 2024, the EAACI conducted a systematic review and meta-analysis to evaluate the diagnostic accuracy of tests for IgE-mediated food allergies, examining studies carried out between 2012 and 2021. This review analyzed 27 studies supporting the diagnosis of CMA. In these studies, the cutoff value for commercial solution SPTs with CM was determined to be 4 mm (52% sensitivity, 80% specificity). For pasteurized CM, the cutoff value for SPTs was 4 mm, with 90% sensitivity and 80% specificity. The cutoff values for spIgE, measured using the ImmunoCAP system, were 3.5 kUA/L for CM spIgE (82% sensitivity, 92% specificity) and 2.6 kUA/L for casein spIgE (67% sensitivity, 93% specificity).23 In our study, similar results were obtained for CM spIgE (cutoff 3.13 kUA/L, 72% sensitivity, 72% specificity) and pasteurized CM SPTs (cutoff 4 mm, 78% sensitivity, 56% specificity). However, lower cutoff values and sensitivity or specificity ratios were found in the case of casein spIgE (cutoff 1.85 kUA/L, 81% sensitivity, 80% specificity) and commercial solution SPTs (cutoff 3.5 mm, 68% sensitivity, 62% specificity). It is thought that the higher sensitivity and specificity rates reported in the meta-analysis may be related to its larger patient population and data accessibility. Despite these differences, our study provides valuable insights for clinical practice, and it highlights the impact of cutoff values obtained from different populations on the diagnostic accuracy of tests. Furthermore, the results obtained in our study, similar to those of the meta-analysis, suggest that the Immulite technique provides consistent results, which are comparable to those achieved using the ImmunoCAP method.
In the multicentre study by Al Hawi et al., the concordance between the spIgE values for CM and wheat, measured using the ImmunoCAP and Immulite 2000 3gAllergy systems, was thoroughly examined. Patients under the age of 1 with positive spIgE were classified as Group A, while patients aged 2–6 with significant symptoms or positive OFC results were classified as Group B. In Group A, allergy confirmation was performed, while in Group B, OFCs were conducted to assess tolerance. A total of 244 CM OFCs were carried out, with objective reactions observed in 152 patients (57 in Group A and 95 in Group B). Six patients (10.5%) in Group A and 11 patients (11.6%) in Group B who met the criteria for anaphylaxis were treated with adrenaline. In Group A, the optimal cutoff value for CM spIgE obtained using ImmunoCAP was 2.36 kU/L, with 80% sensitivity and 73.3% specificity (AUC: 0.798). For the Immulite 2000 3gAllergy test, the cutoff value was 1.96 IU/mL, with 87.7% sensitivity and 70% specificity (AUC: 0.840). In Group B, these values were determined as 5.33 kU/L, with 84.2% sensitivity and 82.8% specificity (AUC: 0.873), and 5.51 IU/mL, with 92.6% sensitivity and 82.8% specificity (AUC: 0.923). In the correlation analysis, a high positive correlation was found between the spIgE cutoff values measured by ImmunoCAP and Immulite 2000 3gAllergy, suggesting that these two testing systems can be used interchangeably for the diagnosis of CMA.16–24 Similarly, Sato et al. compared the diagnostic efficacy of the ImmunoCAP and 3gAllergy systems in a study involving 1561 patients, with 499 patients investigated for milk sensitivity. In 123 patients with positive CM spIgE, allergic symptoms were detected, and 71 patients underwent OFCs. In this study, the cutoff values for ImmunoCAP and 3gAllergy were determined as 0.93 kU/L (AUC: 0.931), with 93% sensitivity and 78% specificity, and 0.95 IU/mL (AUC: 0.926), with 93% sensitivity and 81% specificity, respectively. A strong statistical correlation was found between the two test systems; however, it was suggested that these tests should not be used interchangeably for the diagnosis of CMA.24 Our study differs from these two studies as it only includes patients who experienced reactions during OFCs and is limited to a younger age group, resulting in lower cutoff values. Park et al., in contrast to other studies comparing the ImmunoCAP and Immulite techniques, evaluated 902 paired test results from 209 patients for food allergens (egg white, cow’s milk, wheat, peanut, soybean, and shrimp) and inhalant allergens (Dermatophagoides farinae, cat epithelium, dog epithelium, oak, grass pollen, wormwood, Alternaria, and German cockroach). All allergens, except shrimp, demonstrated strong correlations with correlation coefficients exceeding 0.7.25 Collectively, the findings from these studies support the reliability of the Immulite technique employed in our hospital.
Conclusion
Our study provides important insights into the determination of spIgE cutoff values using the Immulite 2000 system for predicting positive reactions in OFC tests in children with CMA. Notably, the study’s focus on patients with confirmed positive OFC outcomes and inclusion of a young pediatric population enhance the clinical relevance and applicability of the findings.
The identified cutoff values—3.13 kU/L for CM spIgE and 1.85 kU/L for casein spIgE—demonstrated robust sensitivity and specificity, which were supported by complementary SPT cutoffs. These results emphasize the diagnostic utility of the Immulite 2000 system in refining patient selection for OFC, potentially reducing unnecessary exposure and facilitating earlier identification of tolerant individuals.
While sensitivity and specificity values reported in the literature vary due to differences in patient populations, diagnostic purposes, and testing protocols across centers, our data contribute to the growing body of evidence supporting tailored cutoff thresholds that align with specific clinical contexts.
Despite limitations including the exclusion of patients with very high spIgE levels (>100 kU/L) and those with recent anaphylaxis, the study’s design focusing on tolerance OFC outcomes positions its findings as particularly valuable for anticipating tolerance acquisition and guiding clinical decisions in allergy management.
In summary, integrating these Immulite 2000 spIgE cutoff values into routine allergy clinic practice could improve diagnostic accuracy, reduce the burden of unnecessary dietary restrictions, and ultimately contribute to more personalized and effective management strategies for children with CMA.
Authors’ Contributions
All authors contributed equally to this article.
Conflicts of Interest
The authors declare no potential conflicts of interest with respect to research, authorship, and/or publication of this article.
Funding
None.
REFERENCES
1 Savage J, Johns CB. Food allergy: Epidemiology and natural history. Immunol Allergy Clin. 2015;35(1):45–59. 10.1016/j.iac.2014.09.004
2 Gupta RS, Warren CM, Smith BM, Jiang J, Blumenstock JA, Davis MM, et al. Prevalence and severity of food allergies among US adults. JAMA. 2019;2(1):e185630-e. 10.1001/jamanetworkopen.2018.5630
3 Schoemaker A, Sprikkelman A, Grimshaw K, Roberts G, Grabenhenrich L, Rosenfeld L, et al. Incidence and natural history of challenge—Proven cow’s milk allergy in European children-EuroPrevall birth cohort. Allergy. 2015;70(8):963–72. 10.1111/all.12630
4 Pérez-Codesido S, Grifol-Clar E, Petrone MB, Malumbres MG, Garban PA, Tejedor-Alonso MA. Frequency of fatal and recurrent anaphylaxis due to COW’S milk: A systematic review and meta-analysis of observational studies. Pediatr Allergy Immunol. 2023;34(7):e13977. 10.1111/pai.13977
5 Flom JD, Sicherer SH. Epidemiology of cow’s milk allergy. Nutrients. 2019;11(5):1051. 10.3390/nu11051051
6 Jensen SA, Fiocchi A, Baars T, Jordakieva G, Nowak-Wegrzyn A, Pali-Schöll I, et al. Diagnosis and Rationale for Action against Cow’s Milk Allergy (DRACMA) Guidelines update-III—Cow’s milk allergens and mechanisms triggering immune activation. World Allergy Org J. 2022;15(9):100668. 10.1016/j.waojou.2022.100668
7 Dolen WK. IgE antibody in the serum-detection and diagnostic significance. Allergy. 2003;58(8):717–23. 10.1034/j.1398-9995.2003.00281.x
8 Li TM, Chuang T, Tse S, Hovanec-Burns D, El Shami AS. Development and validation of a third-generation allergen-specific IgE assay on the continuous random access IMMULITE® 2000 analyzer. Ann Clin Lab Sci. 2004;34(1):67–74.
9 Hovanec-Burns D, Maldonado S, Huynh D, Kubota H, Chuang T. Specific IgE measurement with common tree nut allergens. J Allergy Clin Immunol. 2010;125(2):AB203.
10 Bulat Lokas S, Plavec D, Rikić Pišković J, Živković J, Nogalo B, Turkalj M. Allergen-specific IgE measurement: Intermethod comparison of two assay systems in diagnosing clinical allergy. J Clin Lab Analysis. 2017;31(3):e22047. 10.1002/jcla.22047
11 Graham F, Bégin P, Paradis L, Lacombe-Barrios J, Paradis J, Des Roches A. Comparison of ImmunoCAP and Immulite serum-specific IgE assays for the assessment of egg allergy. Allergy Asthma Clin Immunol. 2016;12:1–3. 10.1186/s13223-016-0134-0
12 Hamilton RG, Mudd K, White MA, Wood RA. Extension of food allergen-specific IgE ranges from the ImmunoCAP to the IMMULITE systems. Ann Allergy Asthma Immunol. 2011;107(2):139–44. 10.1016/j.anai.2011.04.012
13 Brozek JL, Firmino RT, Bognanni A, Arasi S, Ansotegui I, Assa’Ad AH, et al. World Allergy Organization (WAO) diagnosis and rationale for action against cow’s milk allergy (DRACMA) guideline update–XIV–recommendations on CMA immunotherapy. World Allergy Org J. 2022;15(4):100646. 10.1016/j.waojou.2022.100646
14 Wang J, editor. Utility of component diagnostic testing in guiding oral food challenges to milk and egg. Allergy & Asthma Proceedings; 2016.
15 Castro A, Pastorino AC, Gushken A, Kokron C, Jacob C. Establishing a cut-off for the serum levels of specific IgE to milk and its components for cow’s milk allergy: Results from a specific population. Allergol Immunopathol. 2015;43(1):67–72. 10.1016/j.aller.2013.09.012
16 Al Hawi Y, Nagao M, Furuya K, Sato Y, Ito S, Hori H, et al. Agreement between predictive, allergen-specific IgE values assessed by ImmunoCAP and IMMULITE 2000 3gAllergy™ assay systems for milk and wheat allergies. Allergy Asthma Immunol Res. 2020;13(1):141. 10.4168/aair.2021.13.1.141
17 Woods RK, Stoney RM, Raven J, Walters EH, Abramson M, Thien F. Reported adverse food reactions overestimate true food allergy in the community. Eur J Clin Nutr. 2002;56(1): 31–6. 10.1038/sj.ejcn.1601306
18 Muraro A, Werfel T, Hoffmann-Sommergruber K, Roberts G, Beyer K, Bindslev-Jensen C, et al. EAACI food allergy and anaphylaxis guidelines: Diagnosis and management of food allergy. Allergy. 2014;69(8):1008–25. 10.1111/all.12429
19 Nowak-Węgrzyn A, Assa’ad AH, Bahna SL, Bock SA, Sicherer SH, Teuber SS. Work Group report: Oral food challenge testing. J Allergy Clin Immunol. 2009;123(6):S365–S83. 10.1016/j.jaci.2009.03.042
20 Ballmer-Weber B, Bengtsson U, Blanco C, Ebner C, Hourihane J, Knulst A, et al. Standardization of food challenges in patients with immediate reactions to foods-position paper from the European Academy of Allergology and Clinical Immunology. Allergy. 2004;59(7):690–7. doi: 10.1111/j.1398-9995.2004.00466.x
21 Vandenplas Y, Brueton M, Dupont C, Hill D, Isolauri E, Koletzko S, et al. Guidelines for the diagnosis and management of cow’s milk protein allergy in infants. Arch Disease Childhood. 2007;92(10):902–8. 10.1136/adc.2006.110999
22 Bindslev-Jensen C, Ballmer-Weber B, Bengtsson U, Blanco C, Ebner C, Hourihane J, et al. Standardization of food challenges in patients with immediate reactions to foods-position paper from the European Academy of Allergology and Clinical Immunology. Allergy. 2004;59(7):690–7. 10.1111/j.1398-9995.2004.00466.x
23 Riggioni C, Ricci C, Moya B, Wong D, van Goor E, Bartha I, et al. Systematic review and meta-analyses on the accuracy of diagnostic tests for IgE-mediated food allergy. Allergy. 2024;79(2):324–52. 10.1111/all.15939
24 Sato S, Ogura K, Takahashi K, Sato Y, Yanagida N, Ebisawa M. Usefulness of antigen-specific IgE probability curves derived from the 3gAllergy assay in diagnosing egg, cow’s milk, and wheat allergies. Allergol Int. 2017;66(2):296–301. 10.1016/j.alit.2016.06.012
25 Park KH, Lee J, Sim DW, Lee SC. Comparison of singleplex specific IgE detection immunoassays: ImmunoCAP Phadia 250 and Immulite 2000 3gAllergy. Ann Lab Med. 2018;38(1):23–31. 10.3343/alm.2018.38.1.23